This tutorial will walk you through the basics of using the network analysis software Gephi. It was last updated in Summer 2019 for my DHSI Network Analysis class (which will not be offered in 2020 because teaching back-to-back classes is hard! But I intend to offer it again in 2021). It assumes you already have some familiarity with network analysis by this point, e.g. you know what nodes and edges are, as well as basic network metrics.
Installation
Download Gephi from https://gephi.github.io – currently Gephi is on version 0.9.2 and runs on Mac OS X, Windows, and Linux.
For Mac users, Java comes bundled with the Gephi install – if you don’t have it, Gephi will install it for you. Windows and Linux users who don’t already have it will also need to install Java 7 or Java 8 from https://java.com/en/download/help/index_installing.xml?j=8
Install the packages in the stated order from the download readme
If Windows users have installed Java and get a Java not found error, there is likely a problem with a configuration file. This can be fixed by following the instructions in the following video: https://www.youtube.com/watch?v=iWQWjx6Ot1E
Getting started
Open Gephi and select “New Project” when prompted.

We can add data to Gephi through File < import spreadsheet. Begin with the nodes: Navigate to where you’ve saved the SDFB_people.csv file (NB: I had my class download several files prior to starting work with Gephi) and select it. Make sure the separator is “Comma” and the as table is “Nodes table.” The Charset is “UTF-8.”
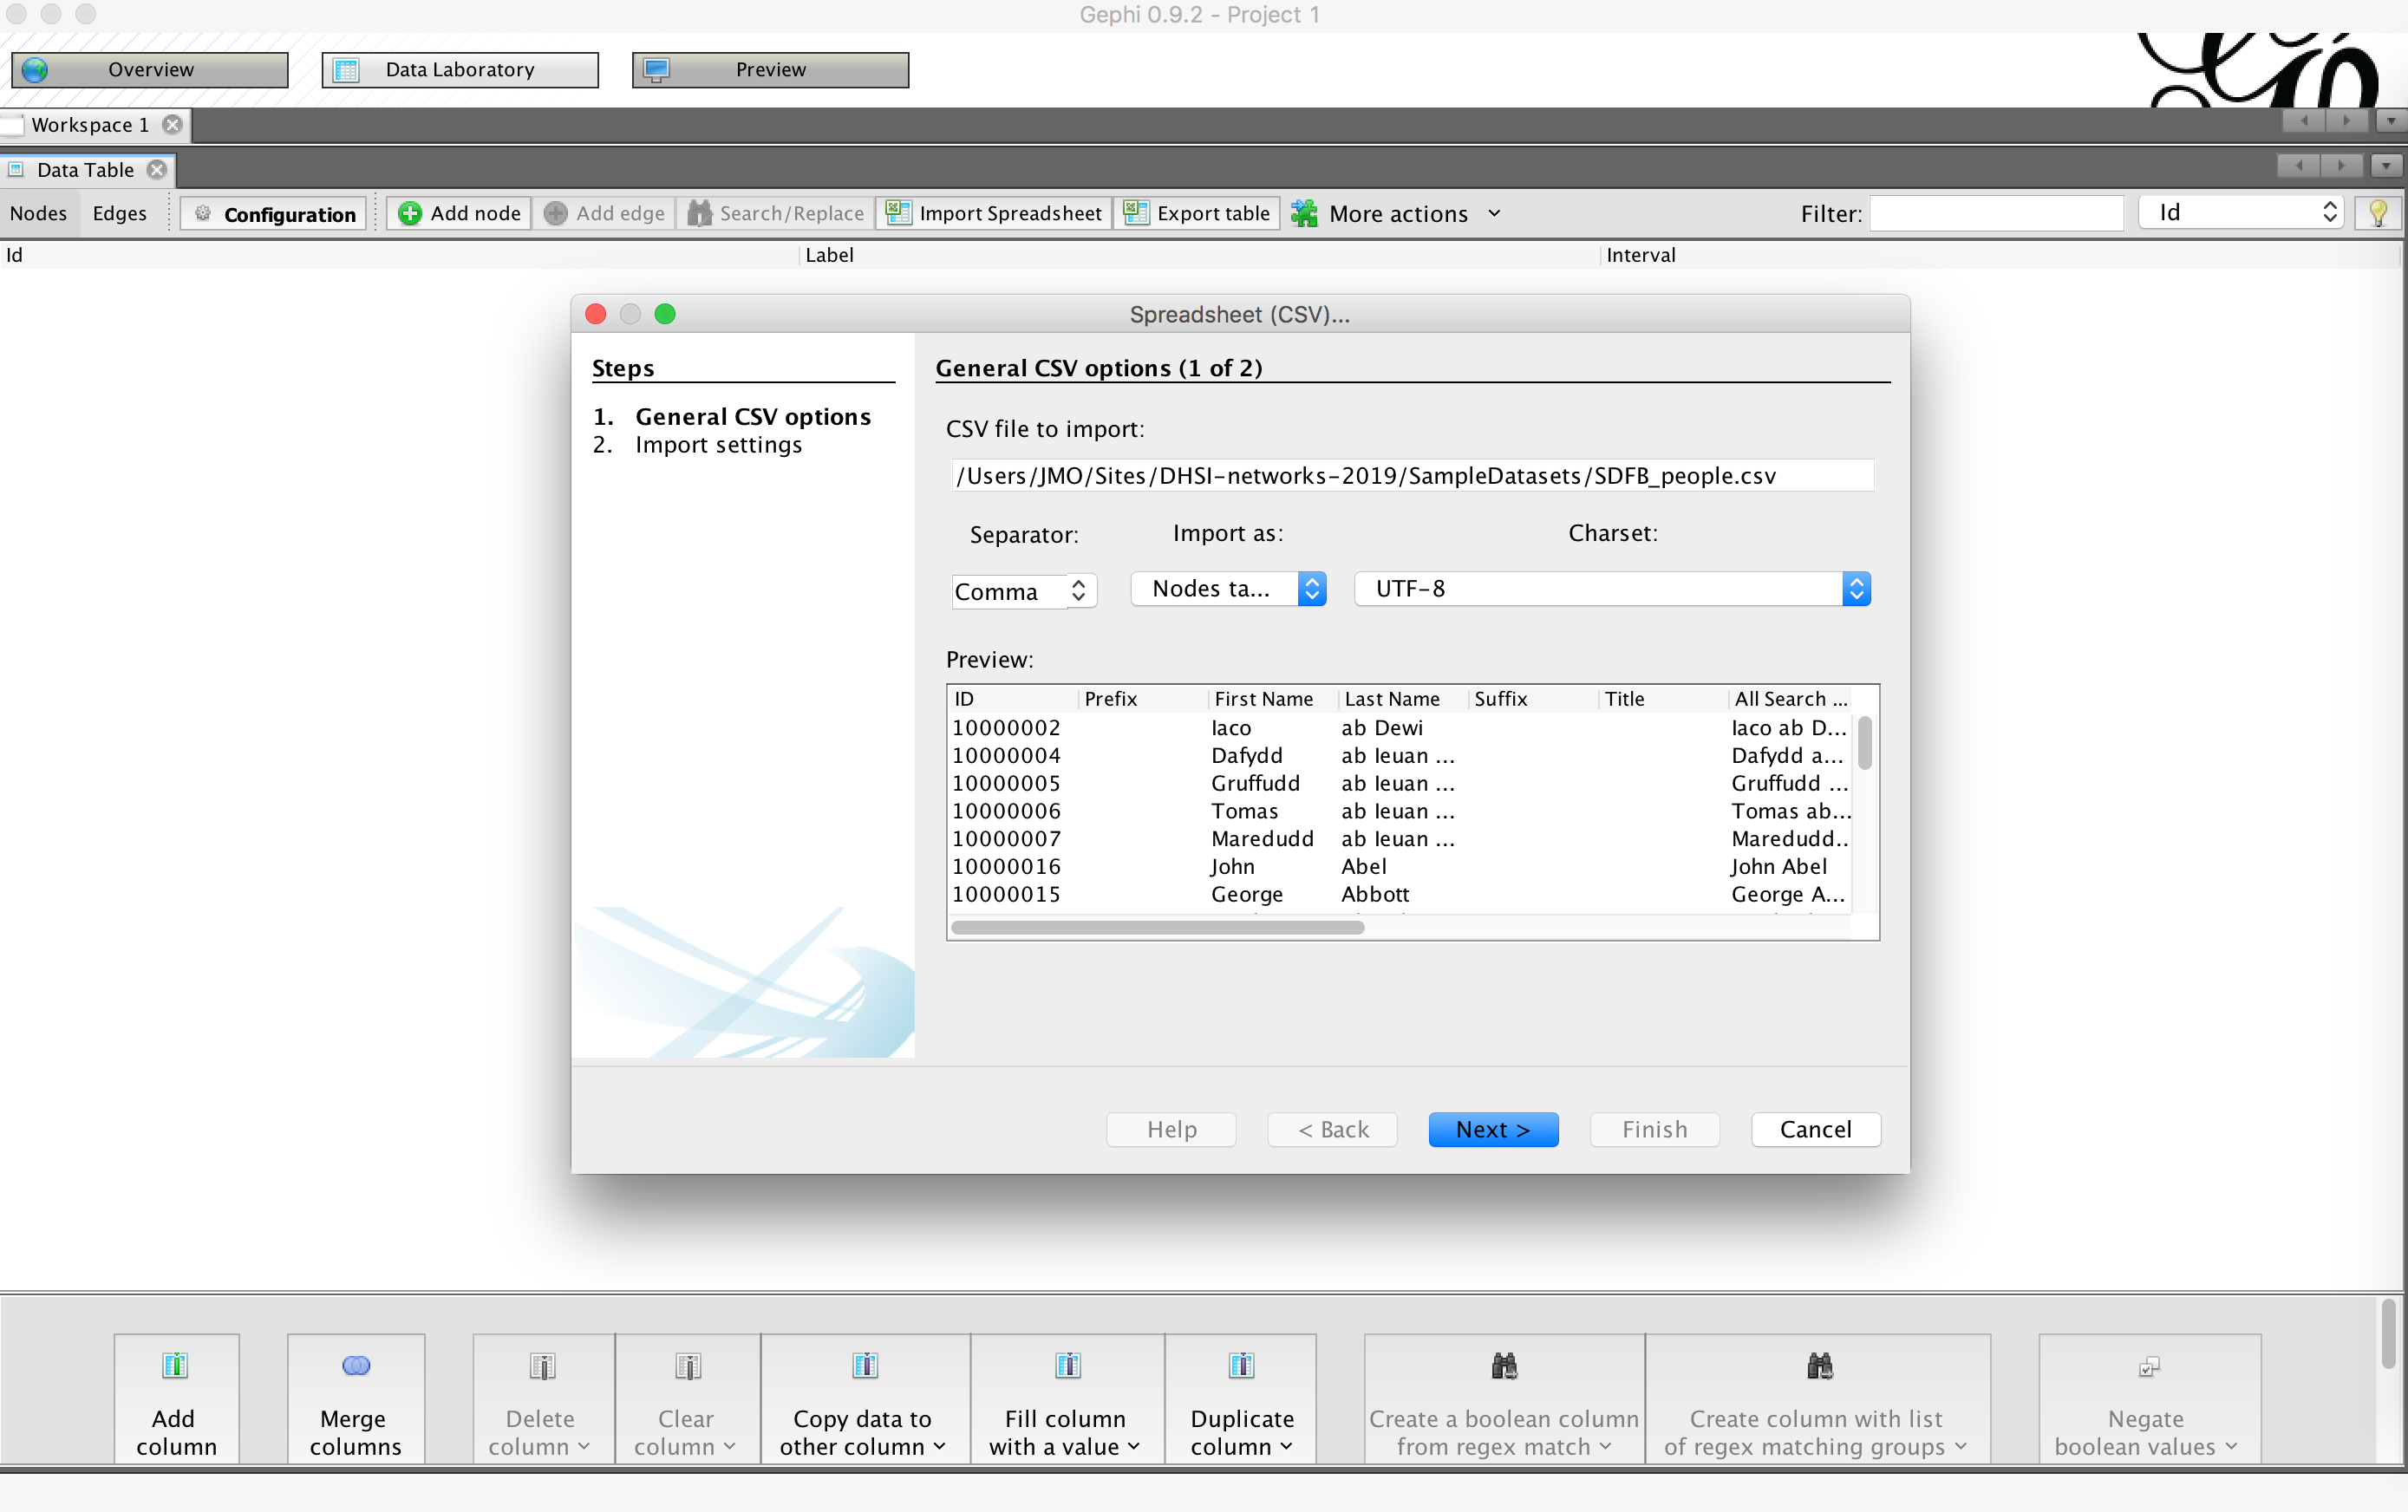
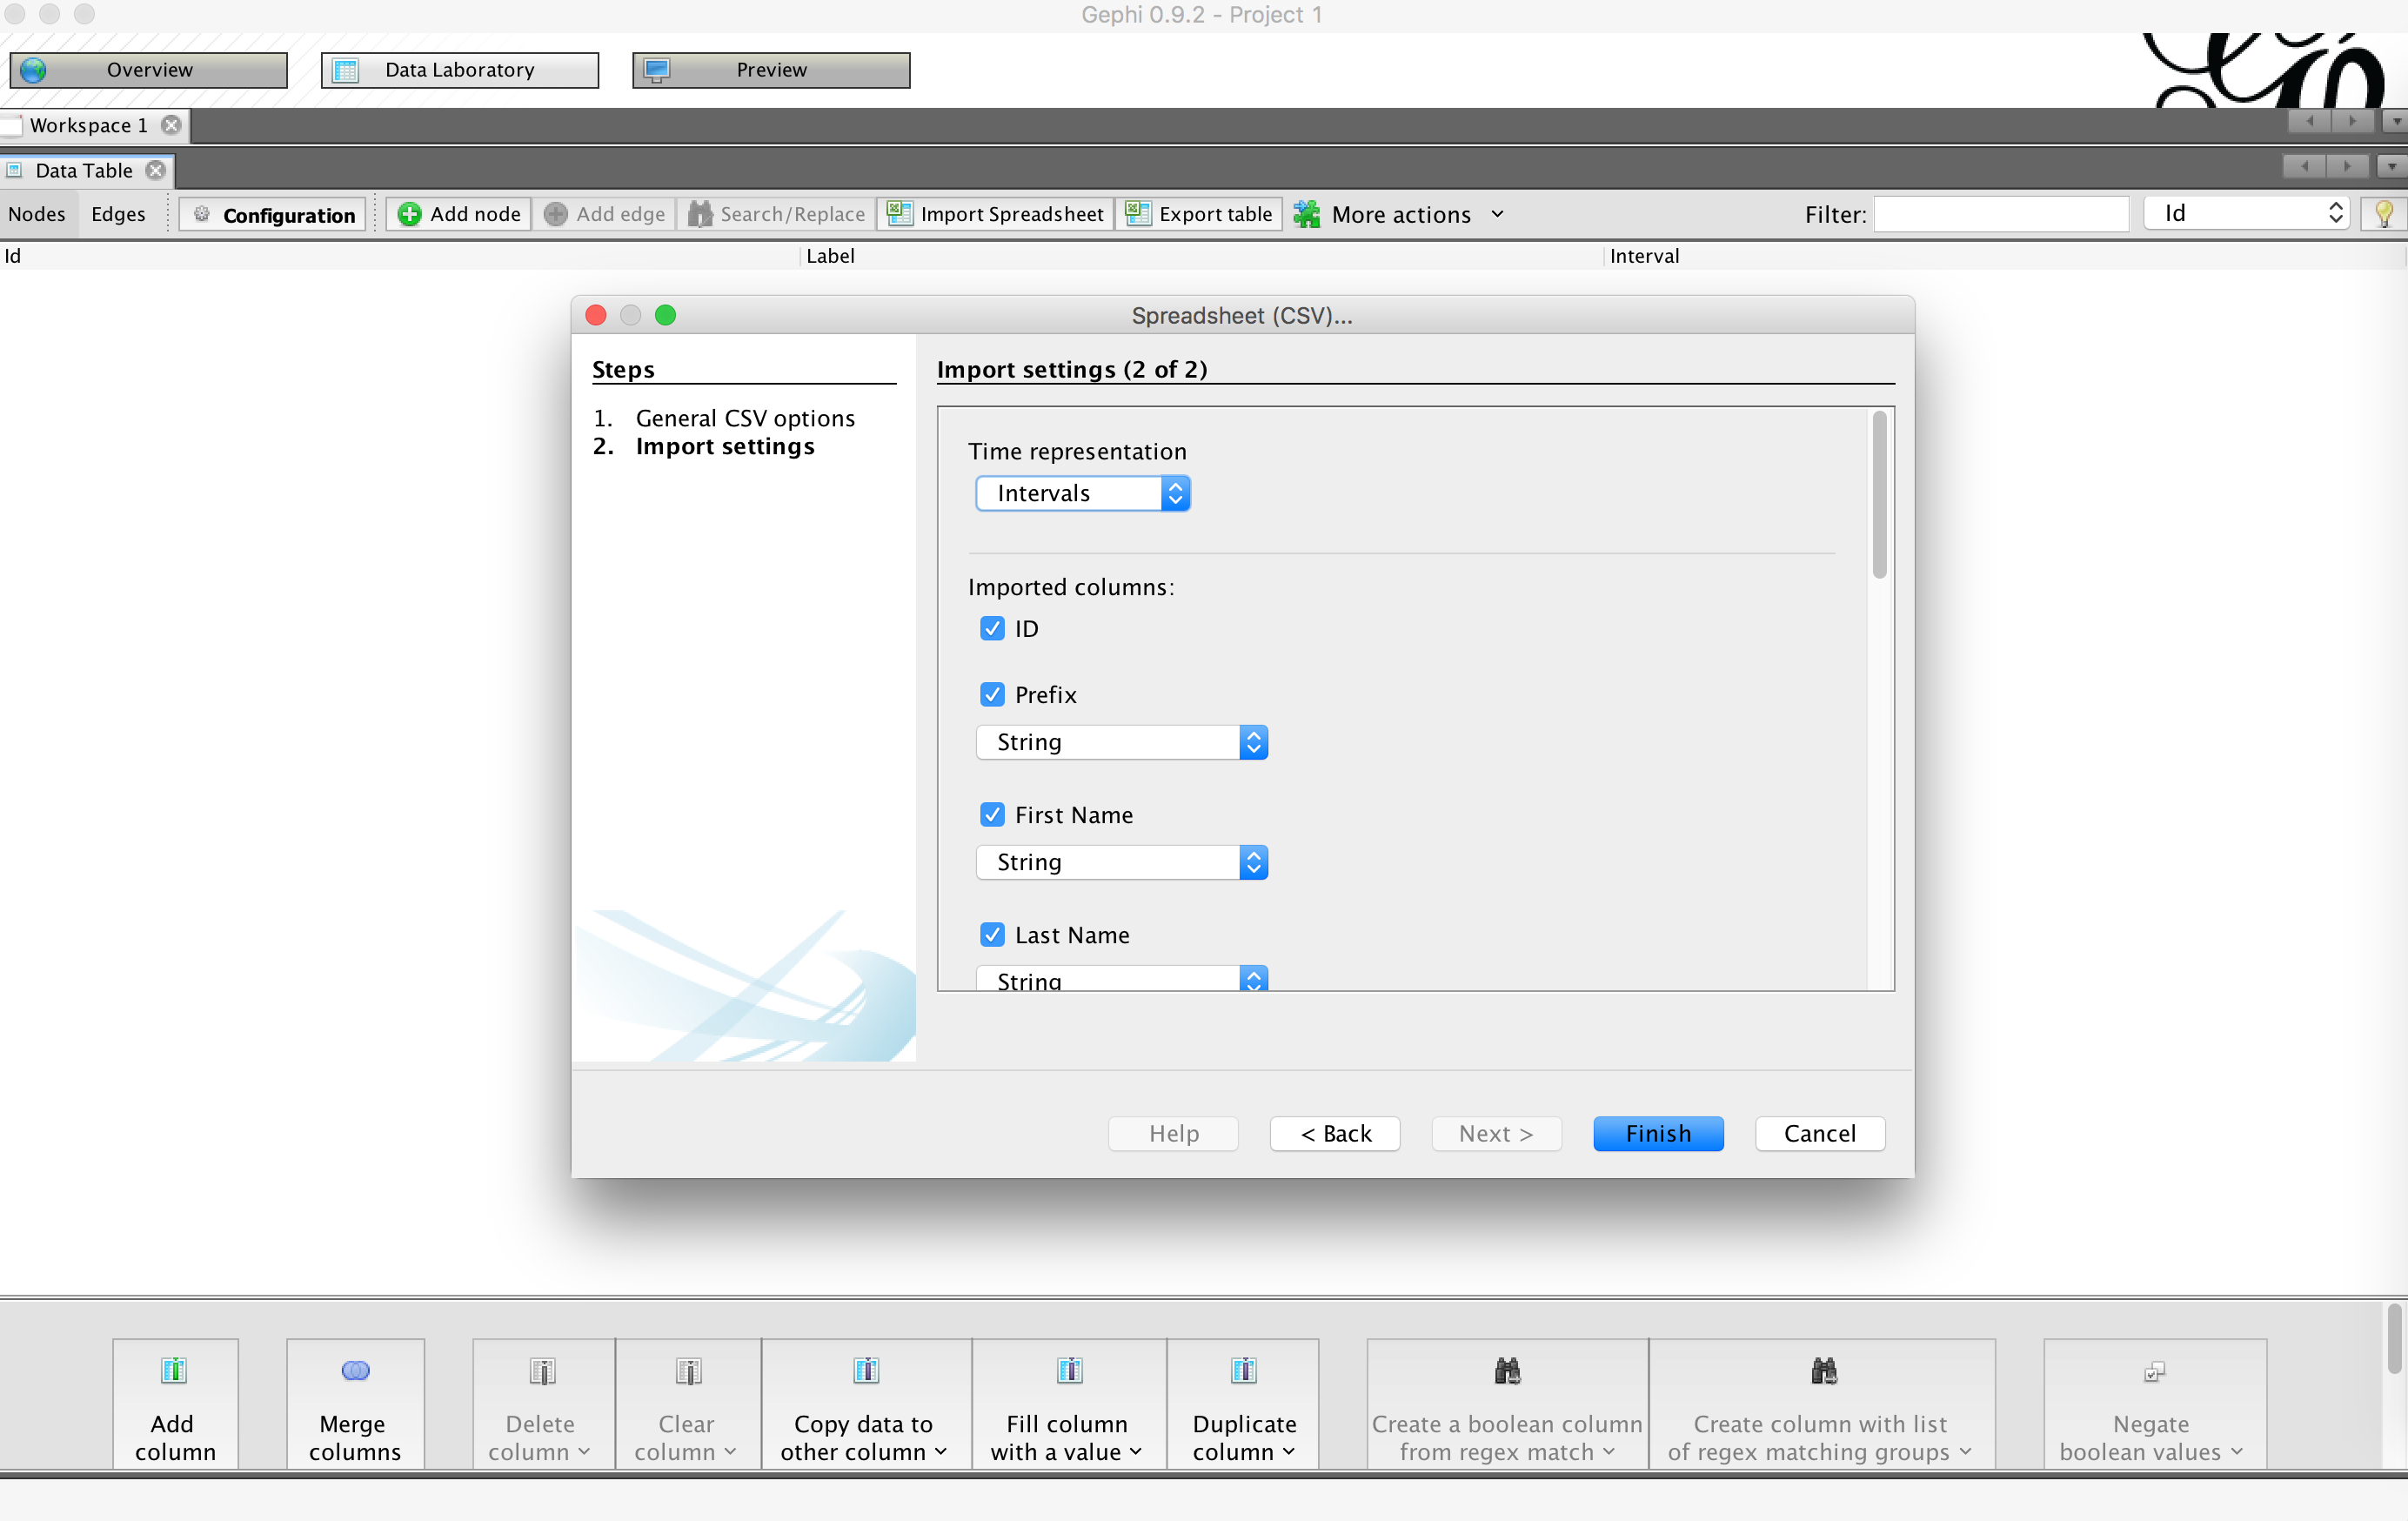
Then click through the next import window. It will let you select types for each of your variables – are they strings (basically, free-text characters), integers, etc? You’ll notice the “ID” column doesn’t give you that option – that’s because the IDs are unique identifiers for the rows and can’t be altered.
The final import window gives you network creation options, which I usually leave as the defaults to begin with. This window will also default to having you append your table to a new workspace – make sure you select the “Append to Existing Workspace” option instead.

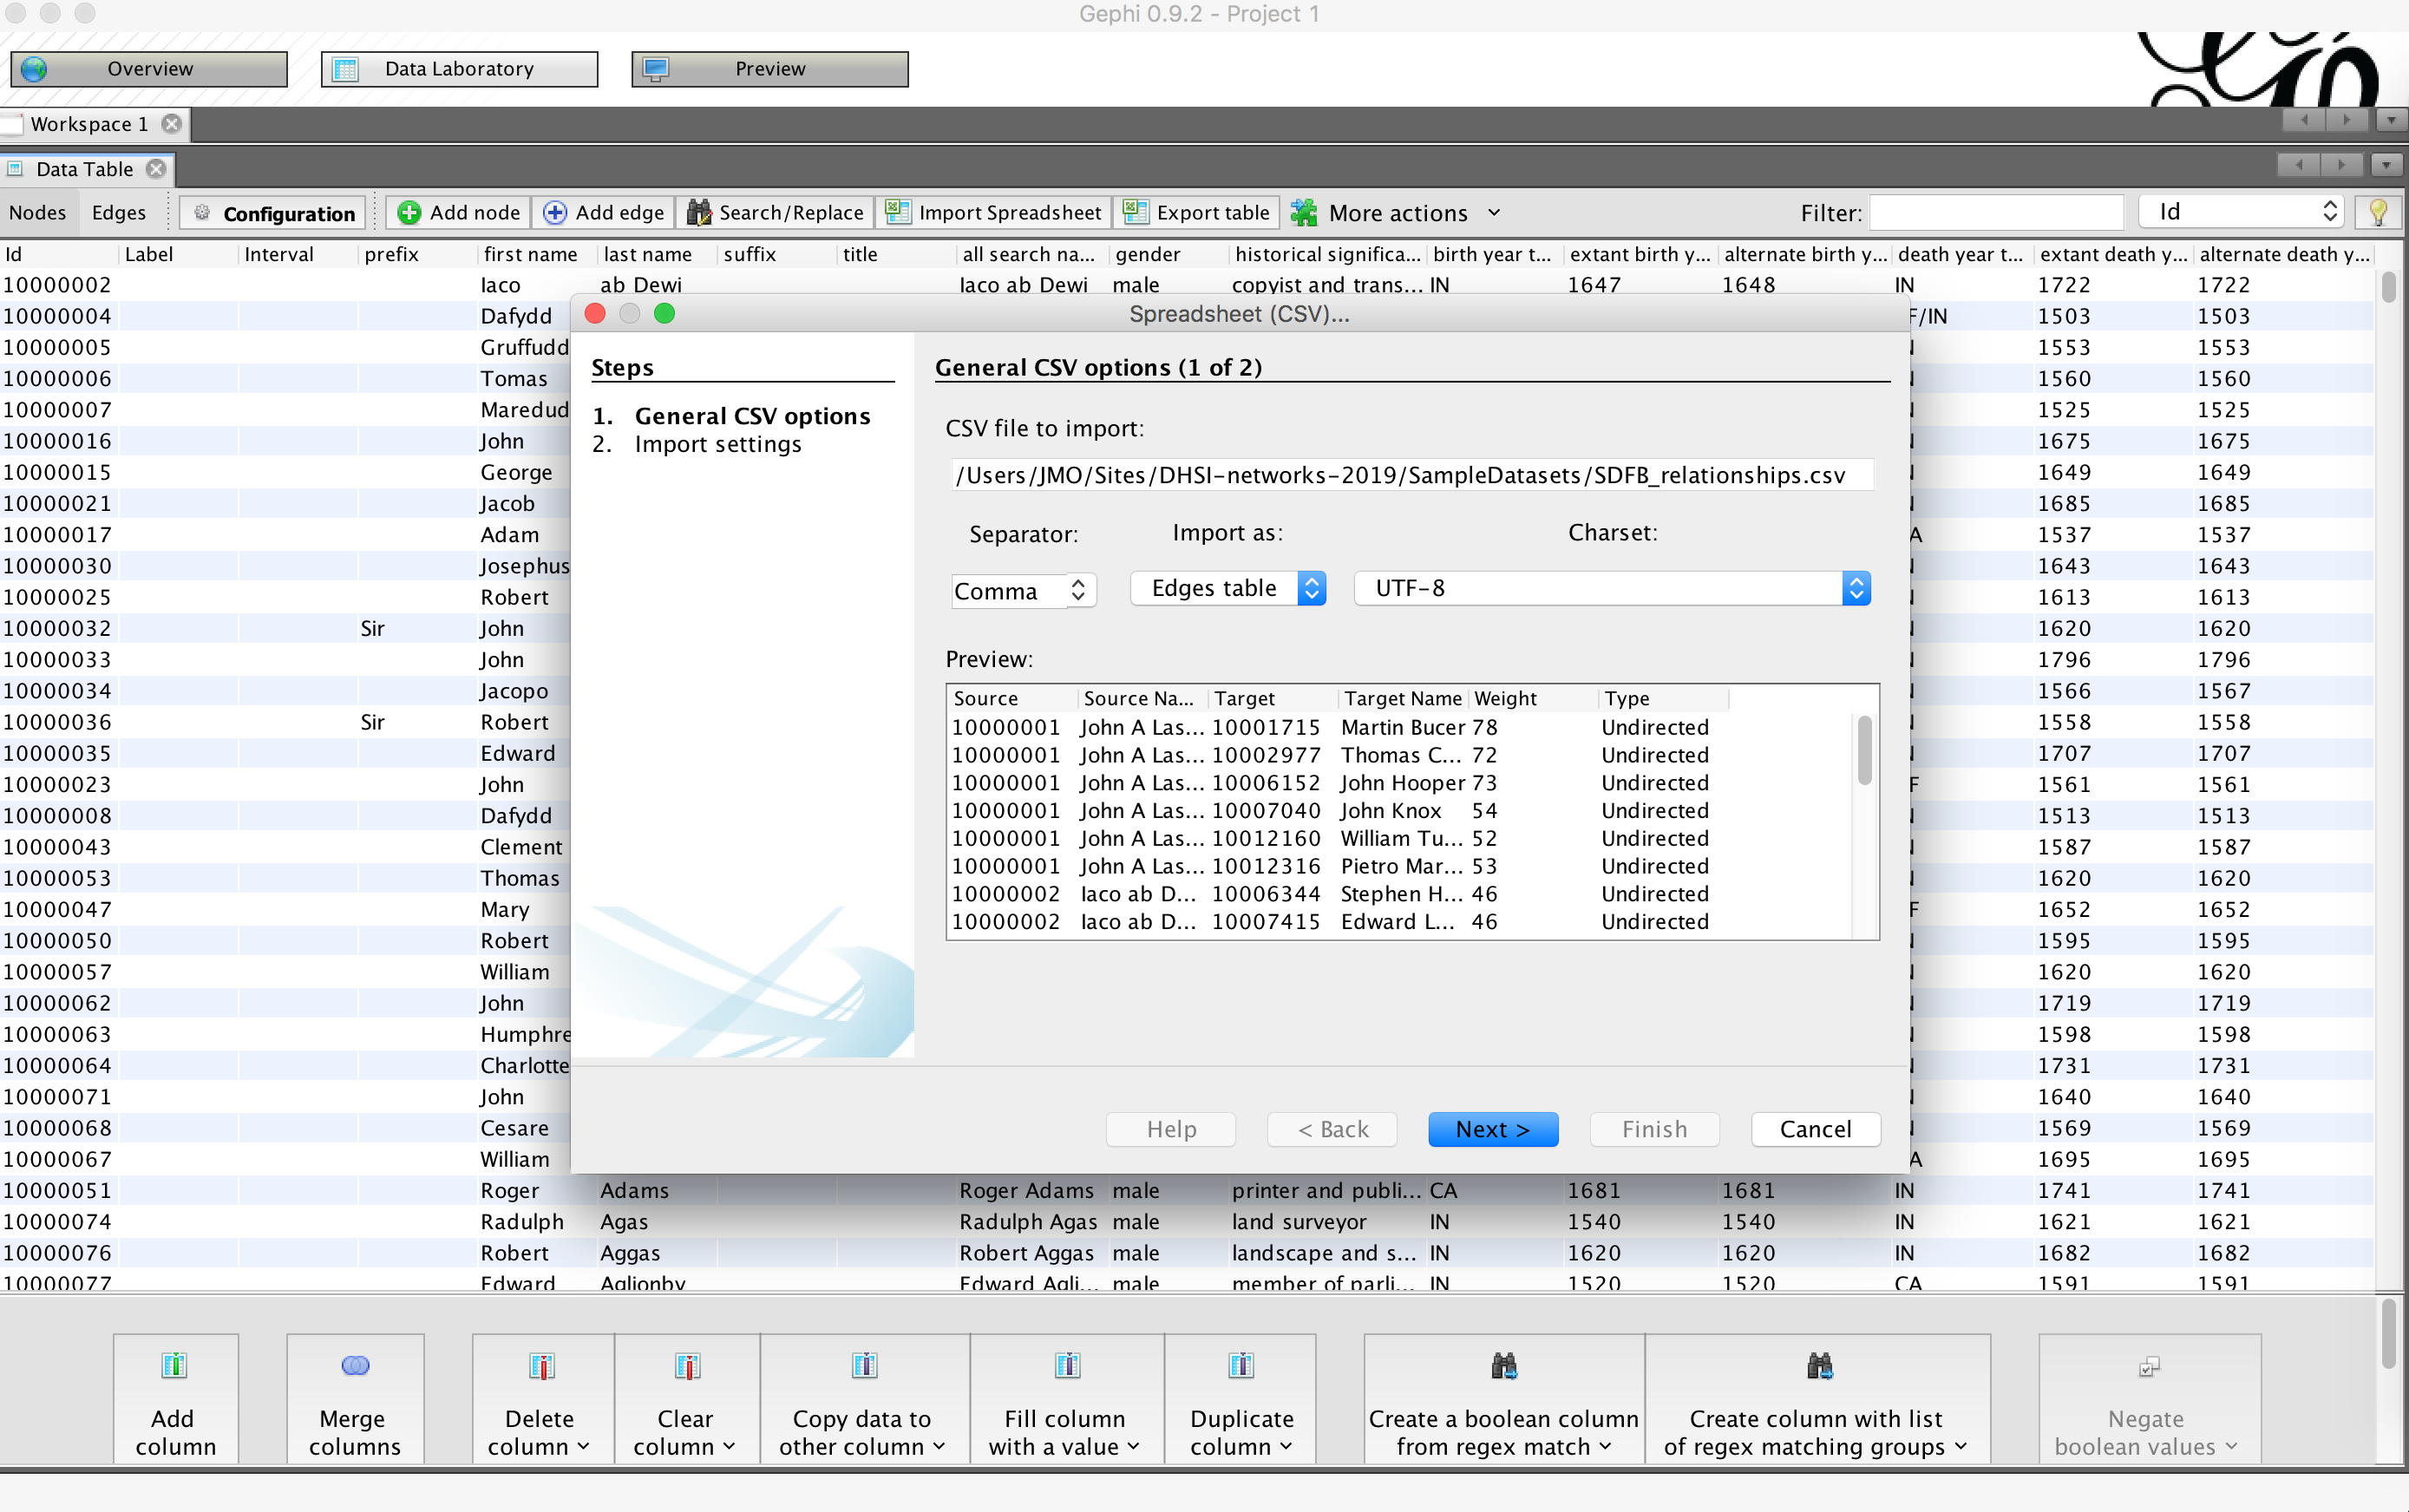
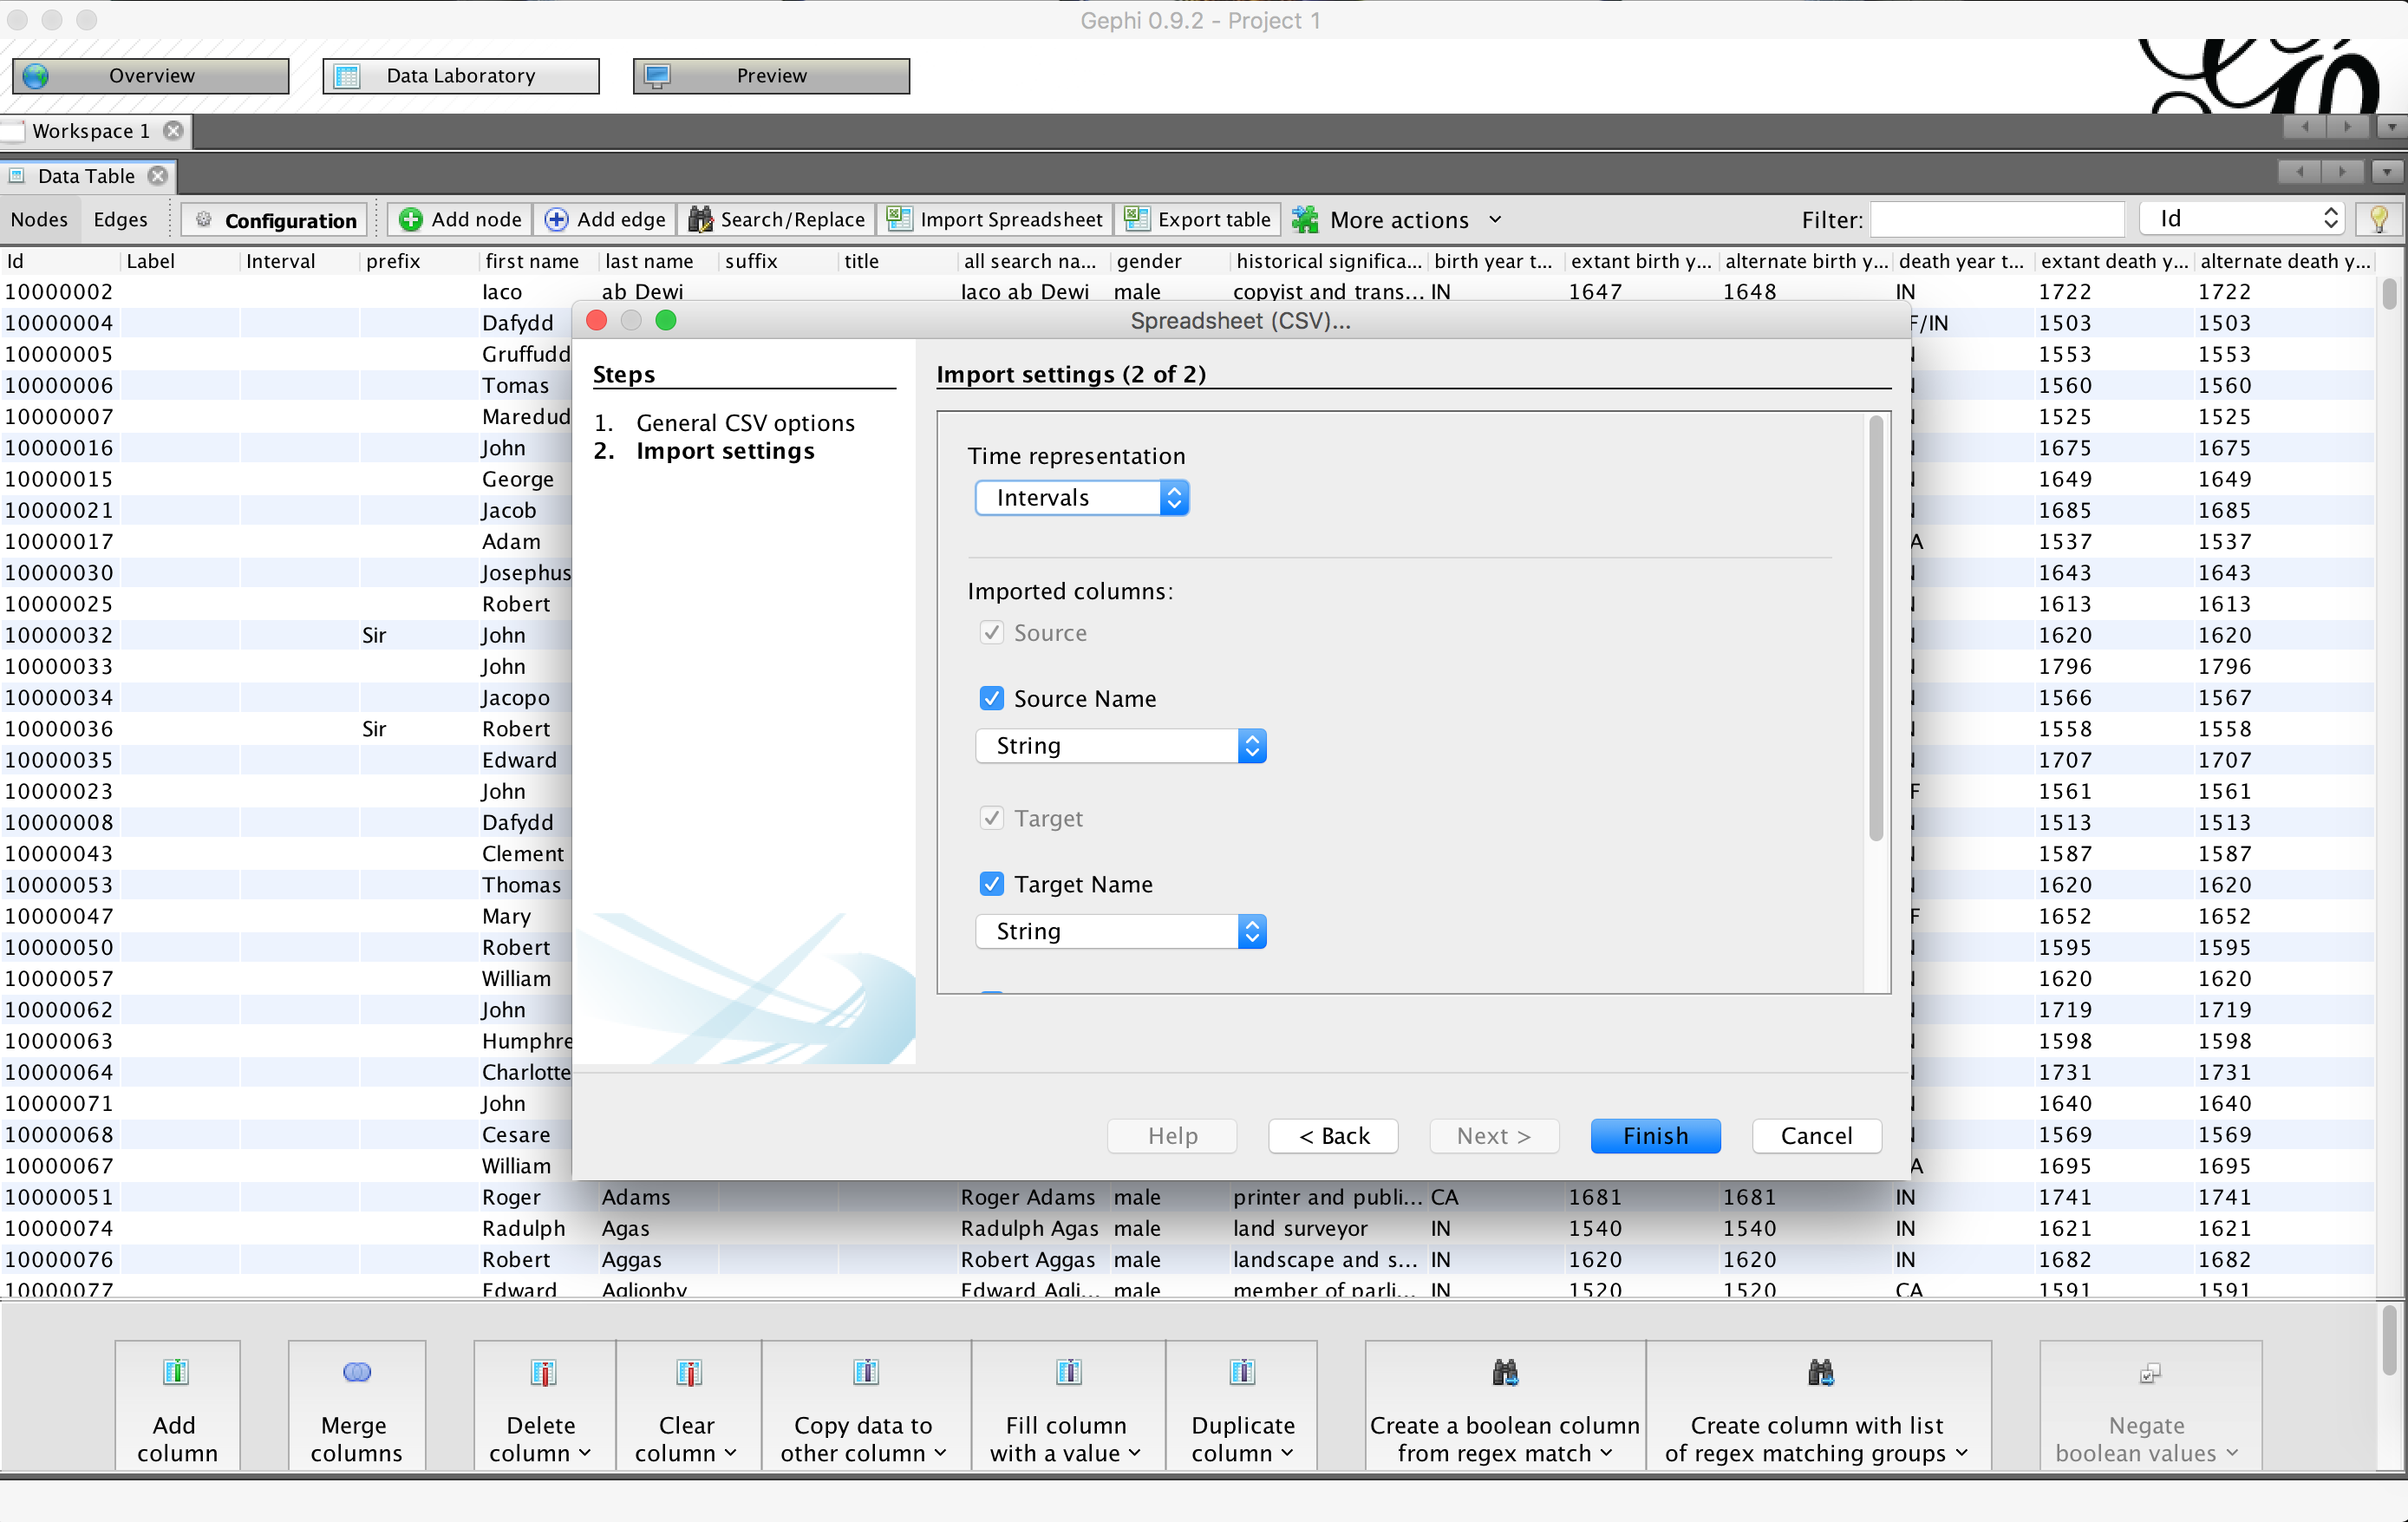
Now repeat this but choose the file SDFB_relationships.csv and select the as table “Edge table.” You’ll notice that “Source” and “Target” are protected the same way as IDs.

There are three main views in Gephi, which are shown with three buttons near the top of the window – the Overview, the Data Laboratory, and the Preview. Click on the Data Laboratory to navigate to that. There are two small buttons on the left side of the screen labeled Nodes and Edges – click on either of those to toggle between a view of the nodes and a view of the edges. Check out the data and notice that there is an empty column – right now our nodes have no Label.
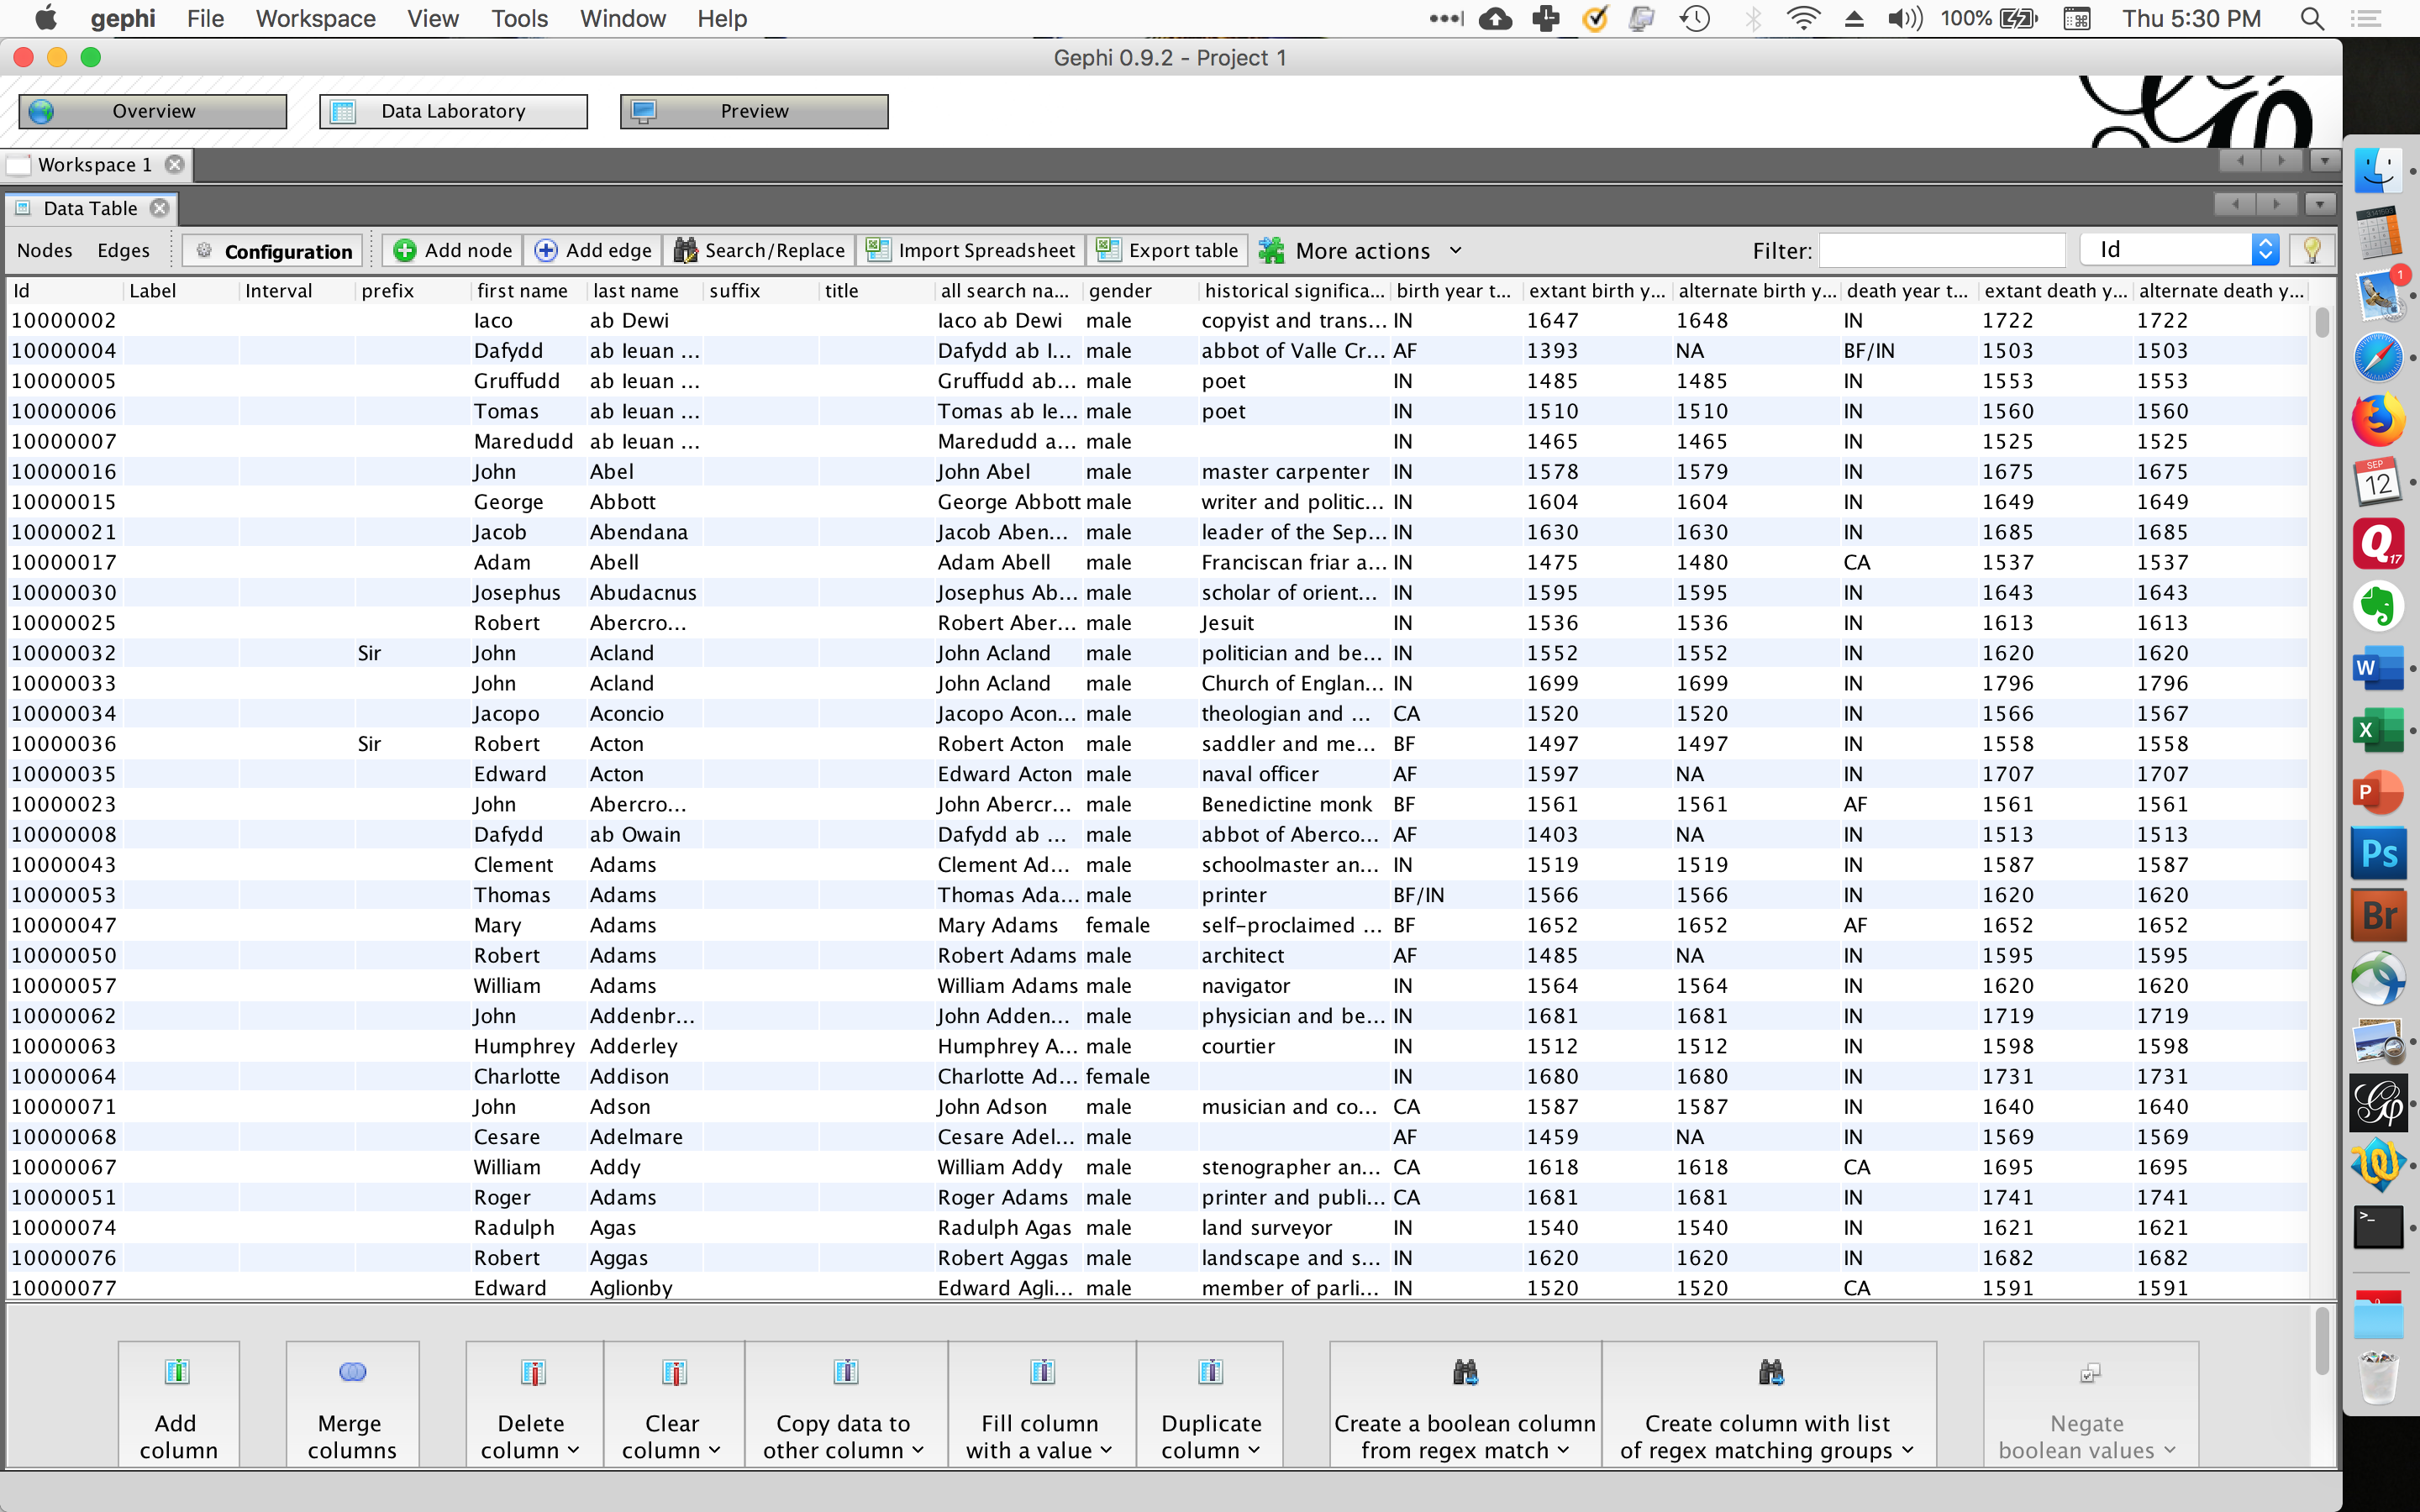
Use the Merge columns button to join the First Name and Last Name columns. When prompted to choose a separator, choose a space (“ “) and give it a new column name of Full Name.
Use the Copy data to other column button to copy the Full Name to the Label column. Now we can label our nodes with people’s full names.
Now click on the Overview button to move to the network visualization. It will look sort of like a Borg cube (yes, I’m a SFF geek). On the lower left side of the screen, there is a button that says “Choose a layout.” Choose “Force Atlas 2” and tell it to Run. After a few minutes, hit Stop so it won’t keep trying to perfect the layout and use all your computer resources. Now it should look sort of like the Eye of Sauron (yeah really, I’m a SFF geek).
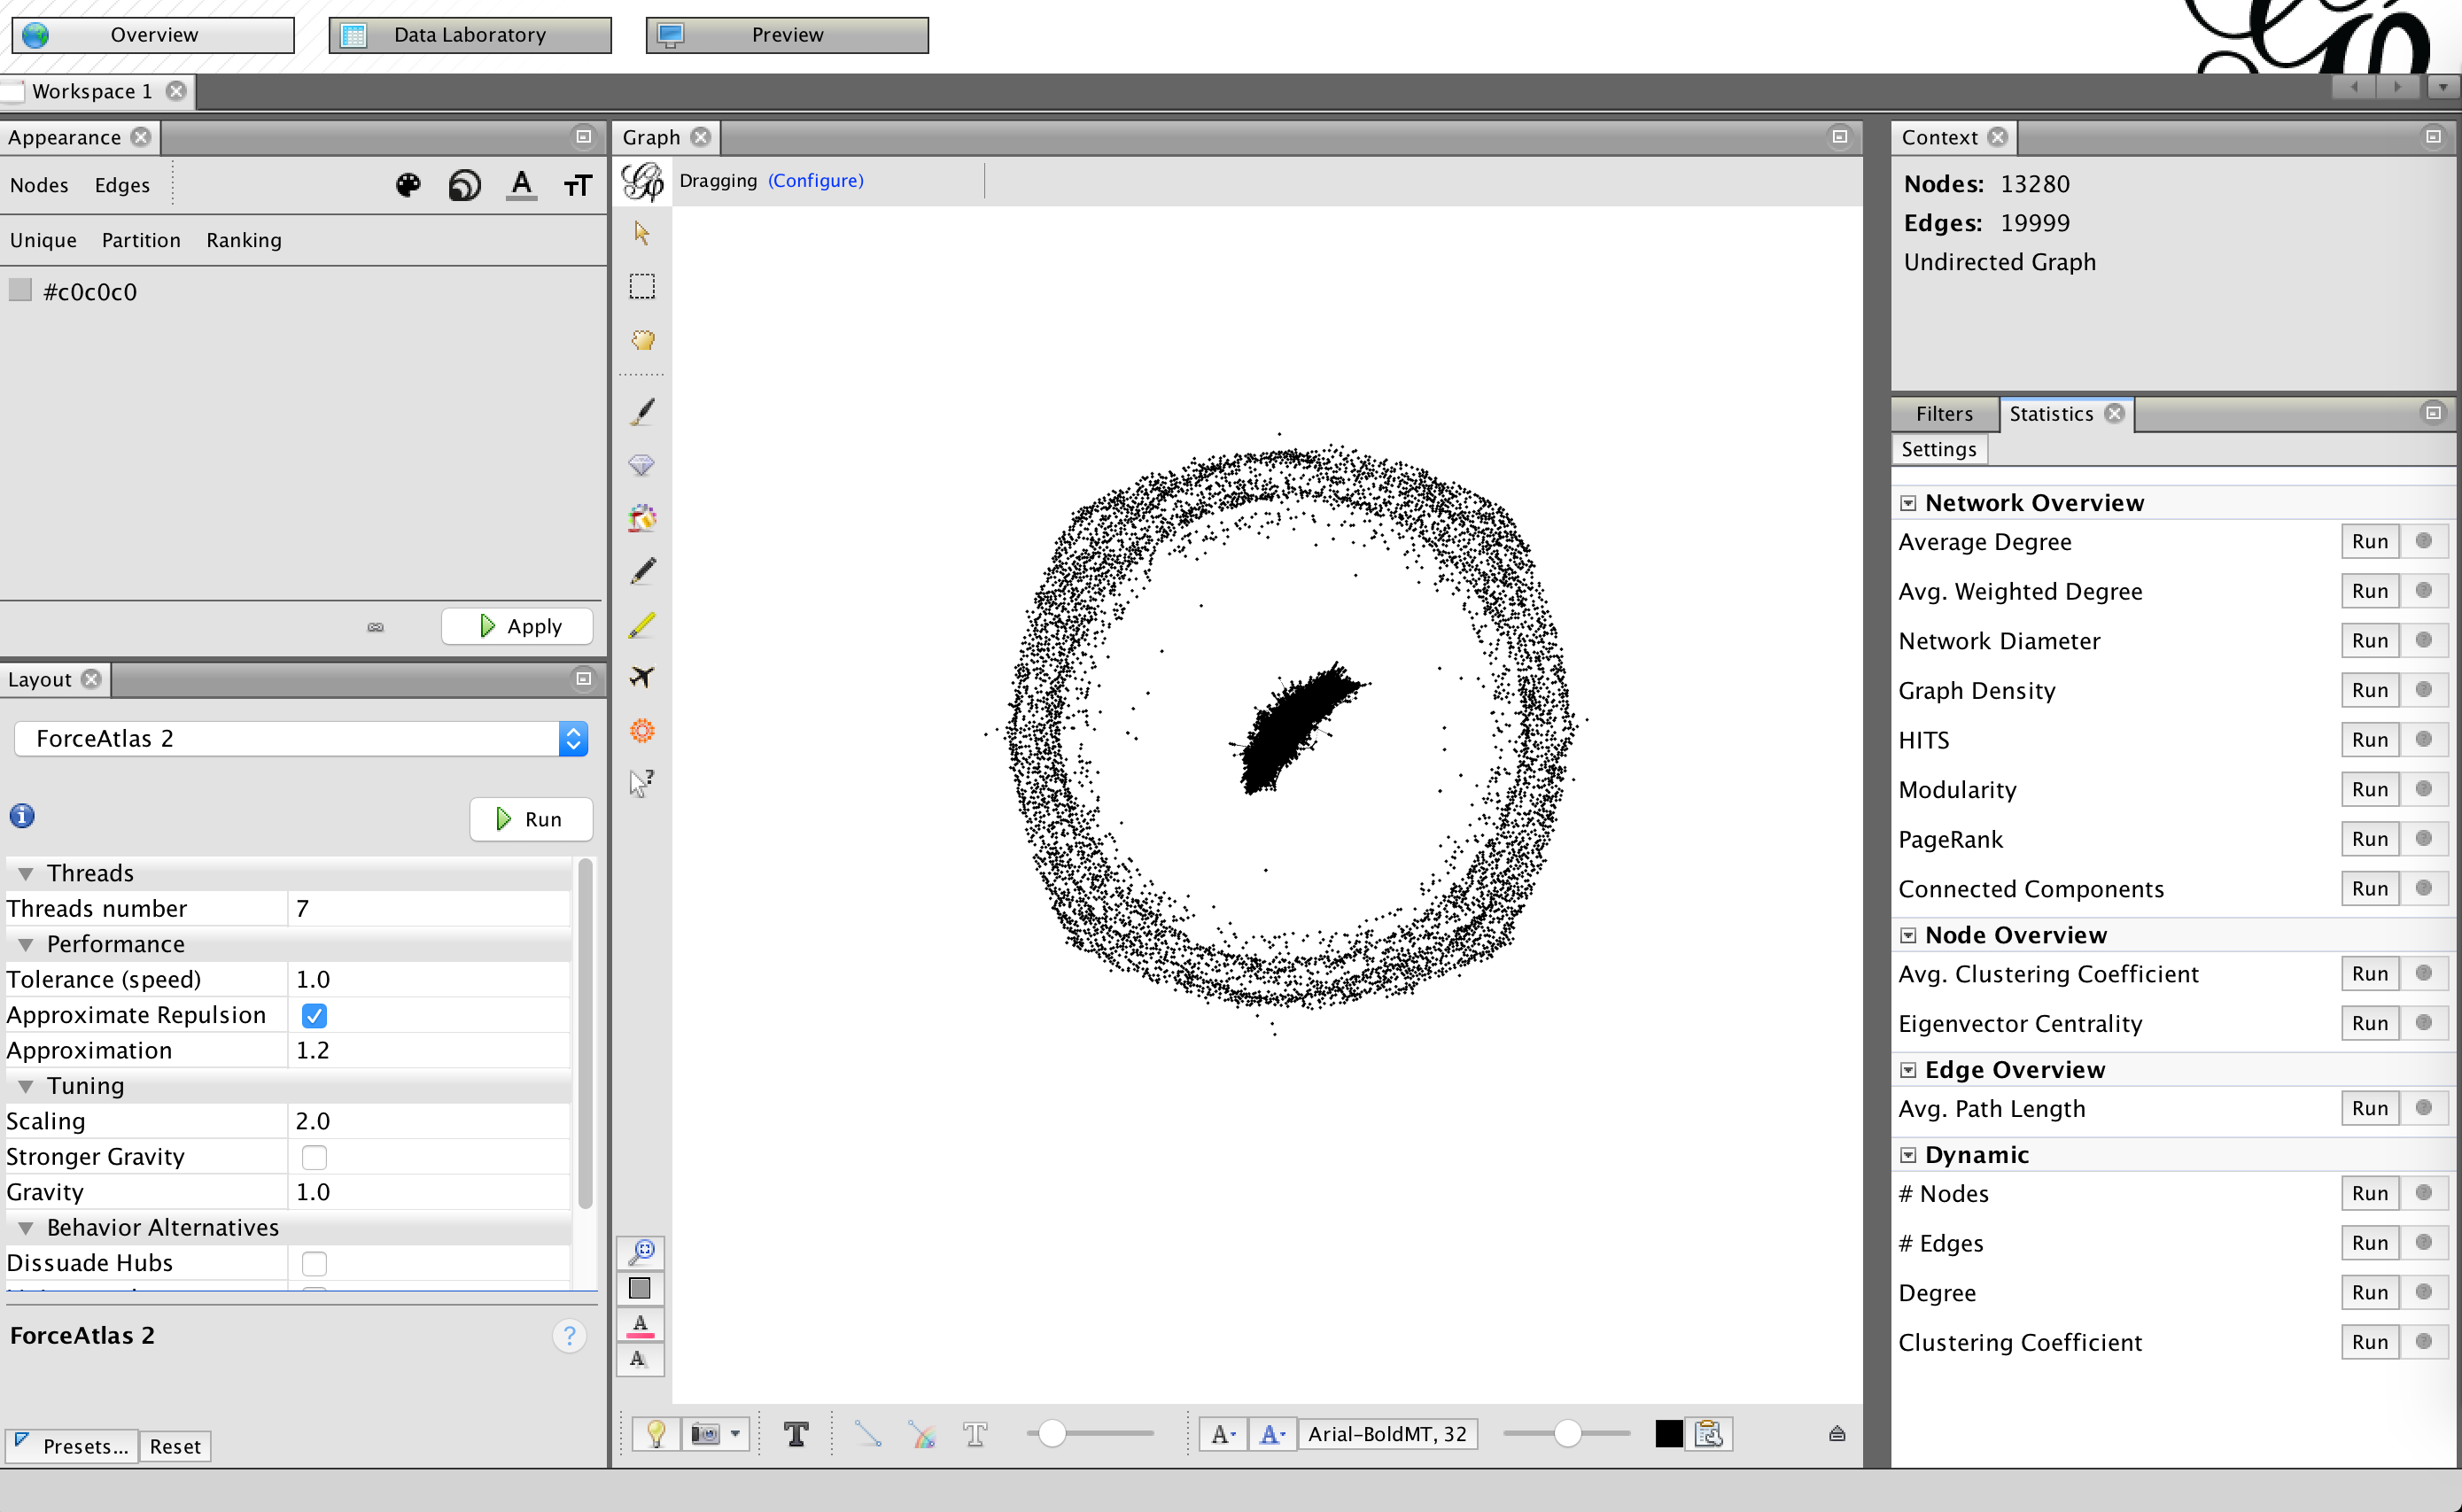
There are a number of buttons on the right side of your screen – these are network metrics that we can calculate. Go ahead and click Average Weighted Degree , Connected Components, Network Diameter, and Eigenvector Centrality.
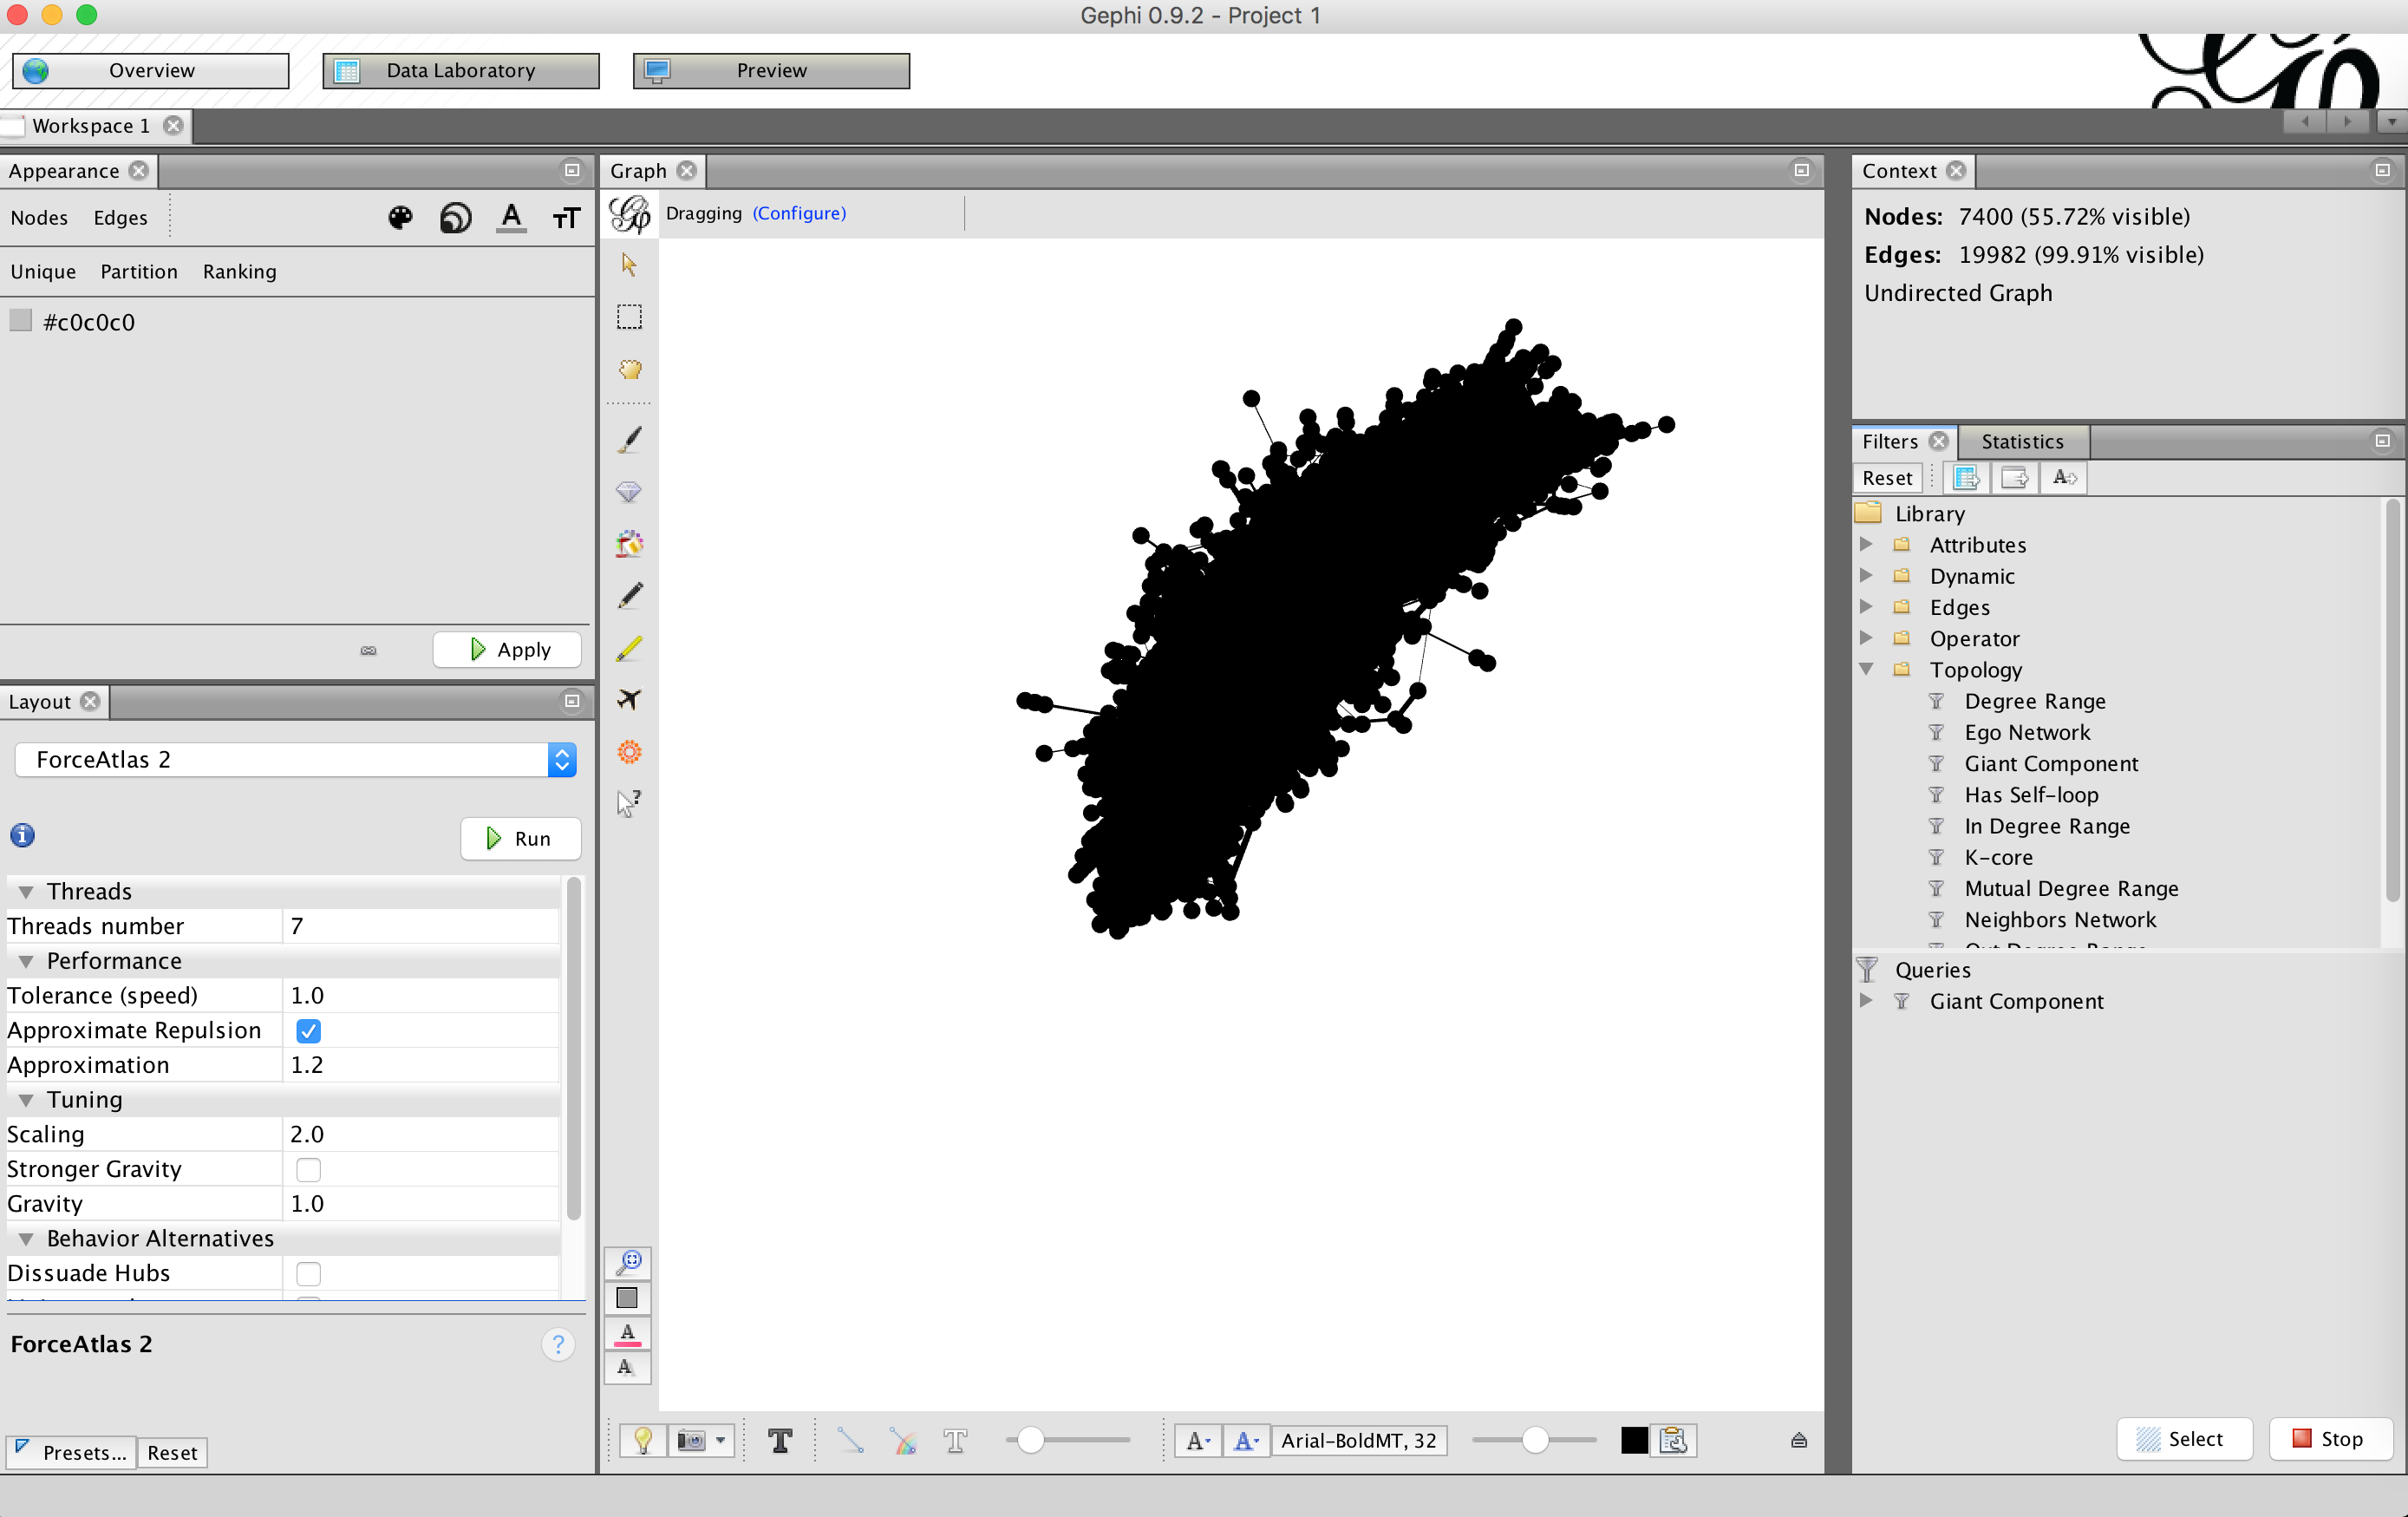
Once Gephi has finished calculating everything, let’s start by removing all the nodes that aren’t in the giant connected component – you’ve been using the Statistics window, but there’s a button right next to the word statistics that is Filters. Click Filters < Topology then find the “Giant Component” – click on it and drag it down to the Queries window. Drop it where it says “Drag filter here” then click the Filter button.
The last of the important windows in this view is on the left top – the Appearance window will let you customize how the nodes look. Select Nodes then the icon that looks like a painter’s color palette to change the node colors. You will have three options to choose for nodes – Unique, Partition, and Ranking. Choose Ranking then in the dropdown choose Weighted Degree (a value we just calculated!) Change the colors as you like, then click Apply.
While you can do som e customization of the graph appearance in the Overview, you can do more in the Preview windows. Select that now and select the box in Node Labels < Show Labels. Then hit Refresh to update the visualization. It isn’t ideal yet, but you can continue to play with the choices in the Preview Settings sidebar to optimize the view. When you like what you’ve found, you can export the image in SVG, PDF, or PNG using the button at the bottom left of the screen.
Lastly, go back to the Data Laboratory and notice that the statistics we calculated in the Overview are now displayed there. Click the Export tables button to export the updated node and edge lists to a CSV that you can use in other programs.
More Resources
- Programming Historian: https://programminghistorian.org/en/lessons/?topic=network-analysis
- Gephi documentation: https://gephi.org/users/