It’s that time of year again: job adverts begin popping up online, academics polish up their CVs, and all the grad students, contingently employed scholars, and other job-seekers begin praying that they’ll be employed this time next year. I’ve been incredibly fortunate to have been employed by Carnegie Mellon University Libraries for the past four years, first as a CLIR-DLF Postdoctoral Fellow in Early Modern Data Curation on the Six Degrees of Francis Bacon and then as the Digital Humanities Specialist.
When I accepted that postdoc, I had no idea what kind of career path I was getting into, I only knew I wanted Six Degrees to exist! But thanks to two years of careful time-logging and an hour or so of data cleaning and visualization, I can now say a little bit about what a DH job in a university library looks like. With the caveat that every institution (and even similar positions within the same institution!) is different, here’s what it looked like for me at CMU.
The Global Stats
I kept consistent track of my hours from January 22, 2017 through August 11, 2018 for a grand total of 81 weeks. In those weeks, I worked a total of 3148.2 hours or an average of 38.87 hours/week. CMU considers “full time” to be 37.5 hours a week, which means I worked 104% of full-time. Given that academia promotes a culture of overwork, I’m quite proud at the work-life (or should I say, work-medicalDrama) balance I managed to achieve.
The Temporal Stats
CMU allowed me flexible work hours, which is to say that I didn’t need to be in the office 9am-5pm every M-F. This is a good thing, because I spent almost the entirety of the 81 weeks covered by this analysis in physical therapy. While I’m happy to talk more elsewhere about disabilities in academia, I’ll just mention here that my flexible working hours were the only thing that kept me from having to go on short-term disability at one point. So it was a win-win for us both.
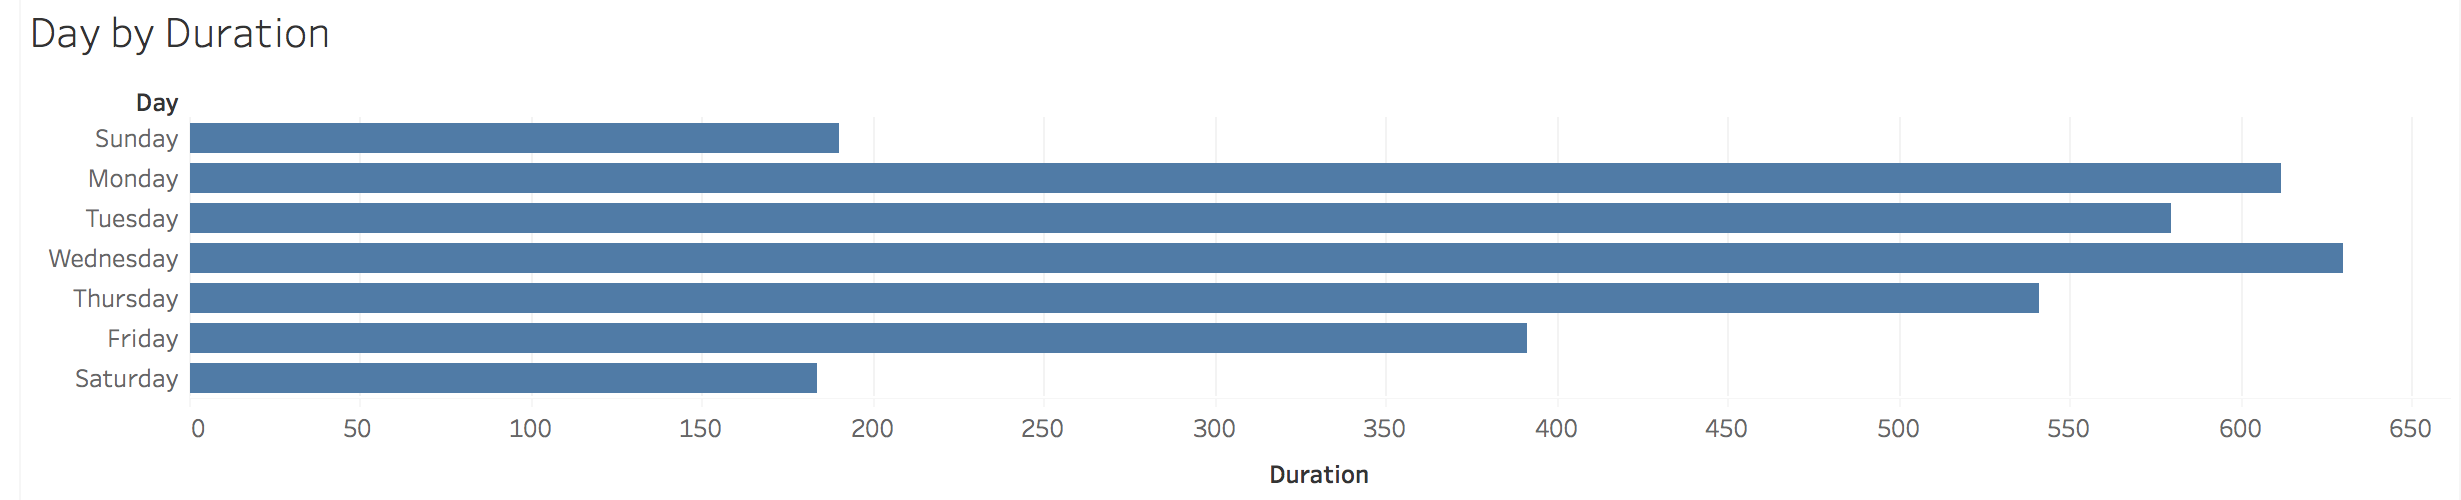
As is indicated in this visualization, I did most of my work in the “compressed” work week of Mondays through Thursdays with around 600 hours on each day. On Fridays, I only managed to do about 2/3 the amount of work I did during those main work days, but I did another 1/3 of that amount each on Saturdays and Sundays. The lack of productivity on Fridays is disappointing (but unsurprising – I always felt burnt out on the week by Friday) because those were supposed to be my dedicated 20% personal research days. However the Saturday/Sunday rebound shows that I did get the work done, just at a slower weekend pace. Not all weekend work was research though; those hours also includes conference travel.
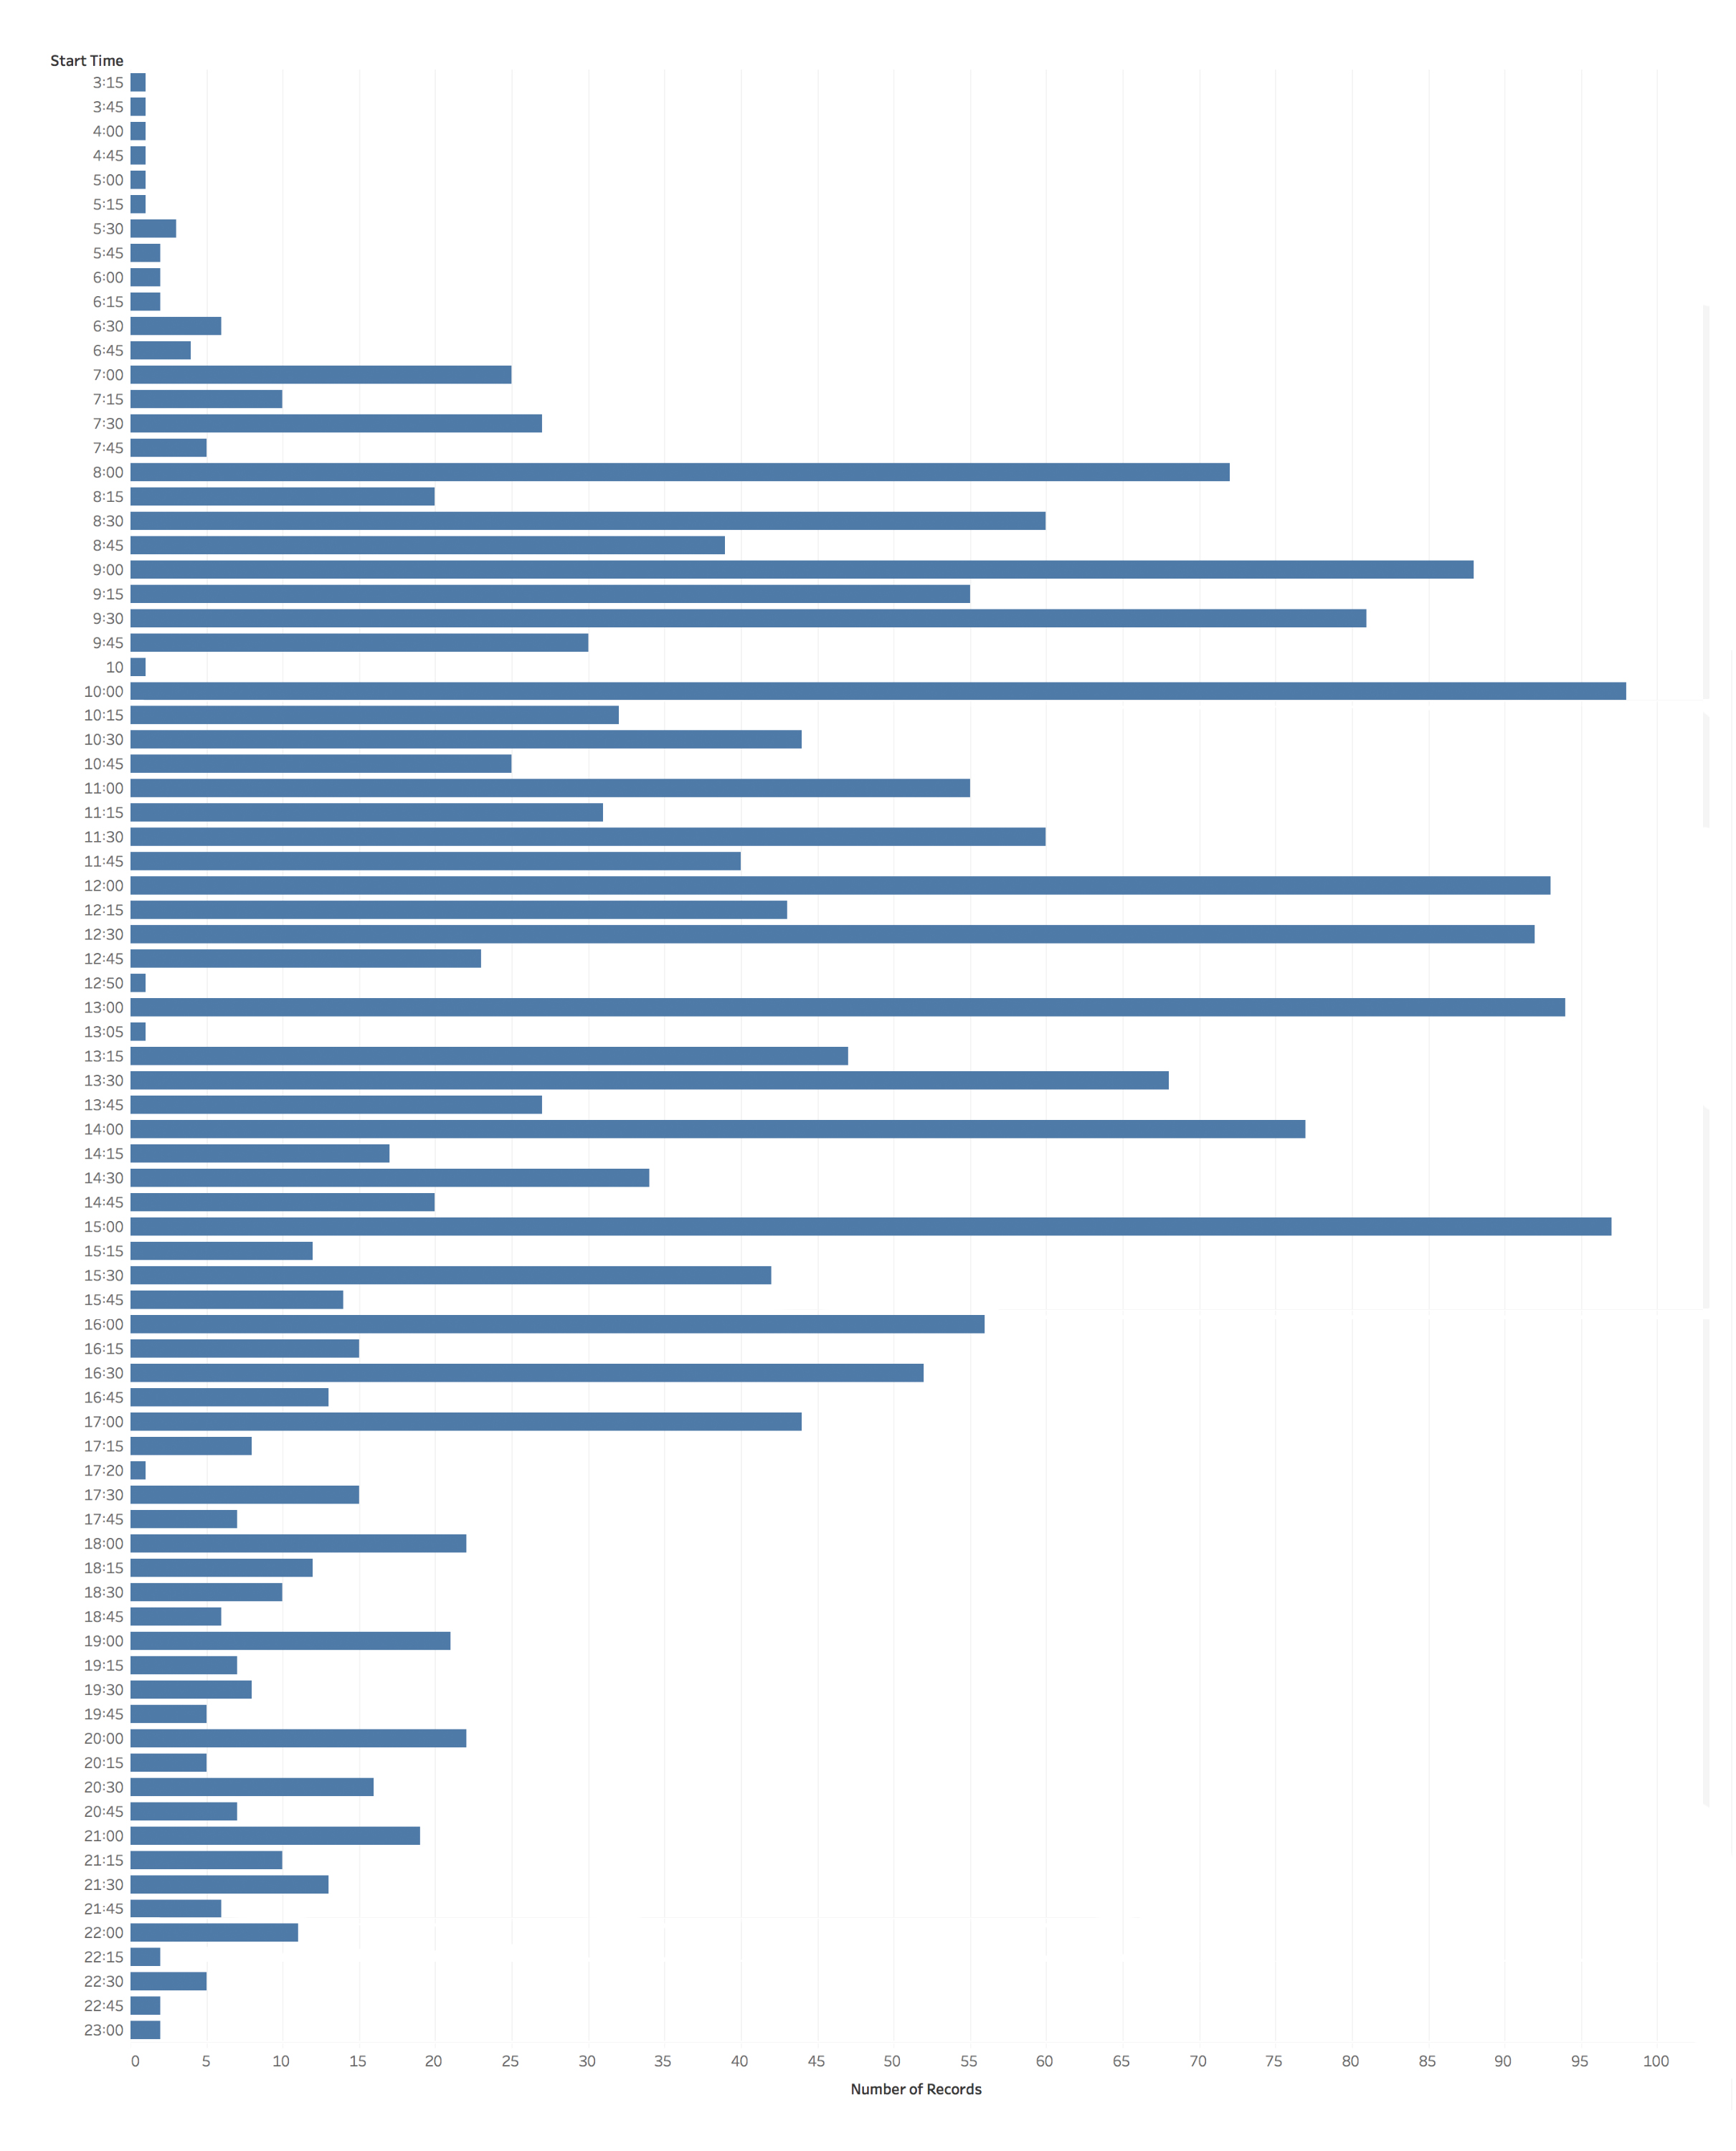
One of the most surprising things I found in my data was that, despite my assertions about not working 9am-5pm, I actually did manage to do most of my work during a normal working day of 8am-4pm. The earliest hours generally reflect conference travel (and if you check out the interactive version of these visualizations via Tableau Public you’ll see one that includes duration alongside start time which shows this) along with a smattering of email checking. While my regular working day sometimes started as early as 6:30 or 7am, my activity levels really spike in the 8-9am period. That slight downtick around 11am reflects my zealously guarded lunch break, while my afternoons had a lot of meetings that started on the hour rather than the quarter or half hours. My activity levels start to drop after the 3pm meetings, but you can still see quite a lot of late afternoon and evening hours that I worked, sometimes up until almost midnight.
The Categorical Stats
That’s nice, you might be thinking, but WHAT did I actually do during my working hours? While many library positions have defined “percent times” that are supposed to be spent on any particular activity, my dean took the position that faculty should have the freedom to determine their own priorities.
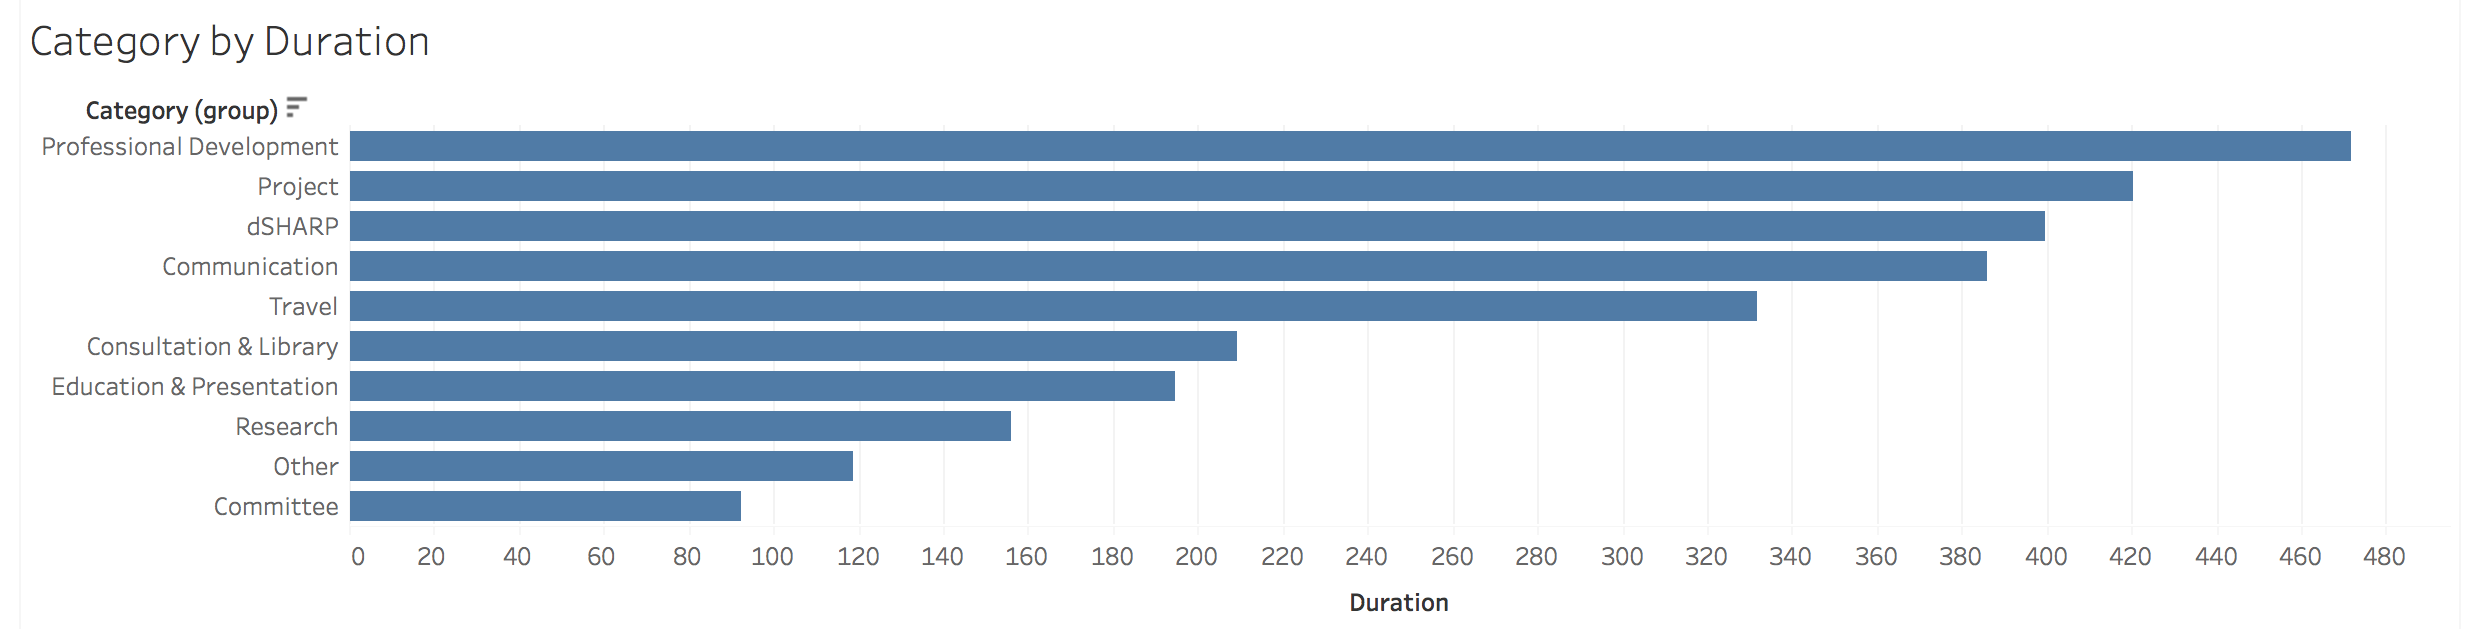
In practice, my time broke out into
- 15% – professional development, including conferences
- 13% – digital projects, including Six Degrees of Francis Bacon, Digits, and the Bridges of Pittsburgh
- 13% – dSHARP digital scholarship center, including co-writing the proposal to found the center, outreach and networking, setting up the administrative infrastructure for the center to run, organizing and running events, and our weekly “office hours”
- 12% – communication (particularly email… so much email…)
- 11% – travel (both around Pittsburgh and to conferences)
- 7% – consultations, library meetings, book orders, and other library administrative tasks
- 6% – teaching (guest lectures, managing independent studies, and workshops)
- 5% – personal research
- 4% – “other,” which is my category for activities such as networking, organization, and documentation
- 3% – committees
If I were to collapse that down into more “global” categories, I would characterize this as:
- 39% – dSHARP, consultations, communication, committees, and other library administration/service
- 33% – research, digital projects, and professional development
- 11% – travel (both around Pittsburgh and to conferences)
- 6% – teaching (guest lectures, managing independent studies, and workshops)
(For the eagle-eyed mathematicians among you, the missing 11% were holidays and paid time off, aka vacation days, and yes I took real vacations.)
When I put it that way, it’s clear my job was awesome! But for folks who haven’t spent a lot of time working in a library or on digital projects, it may not be entirely clear what I actually mean when I talk about co-running dSHARP or collaborating on a digital project. For that, my sub-categories will be far more revealing of my day-to-day reality.
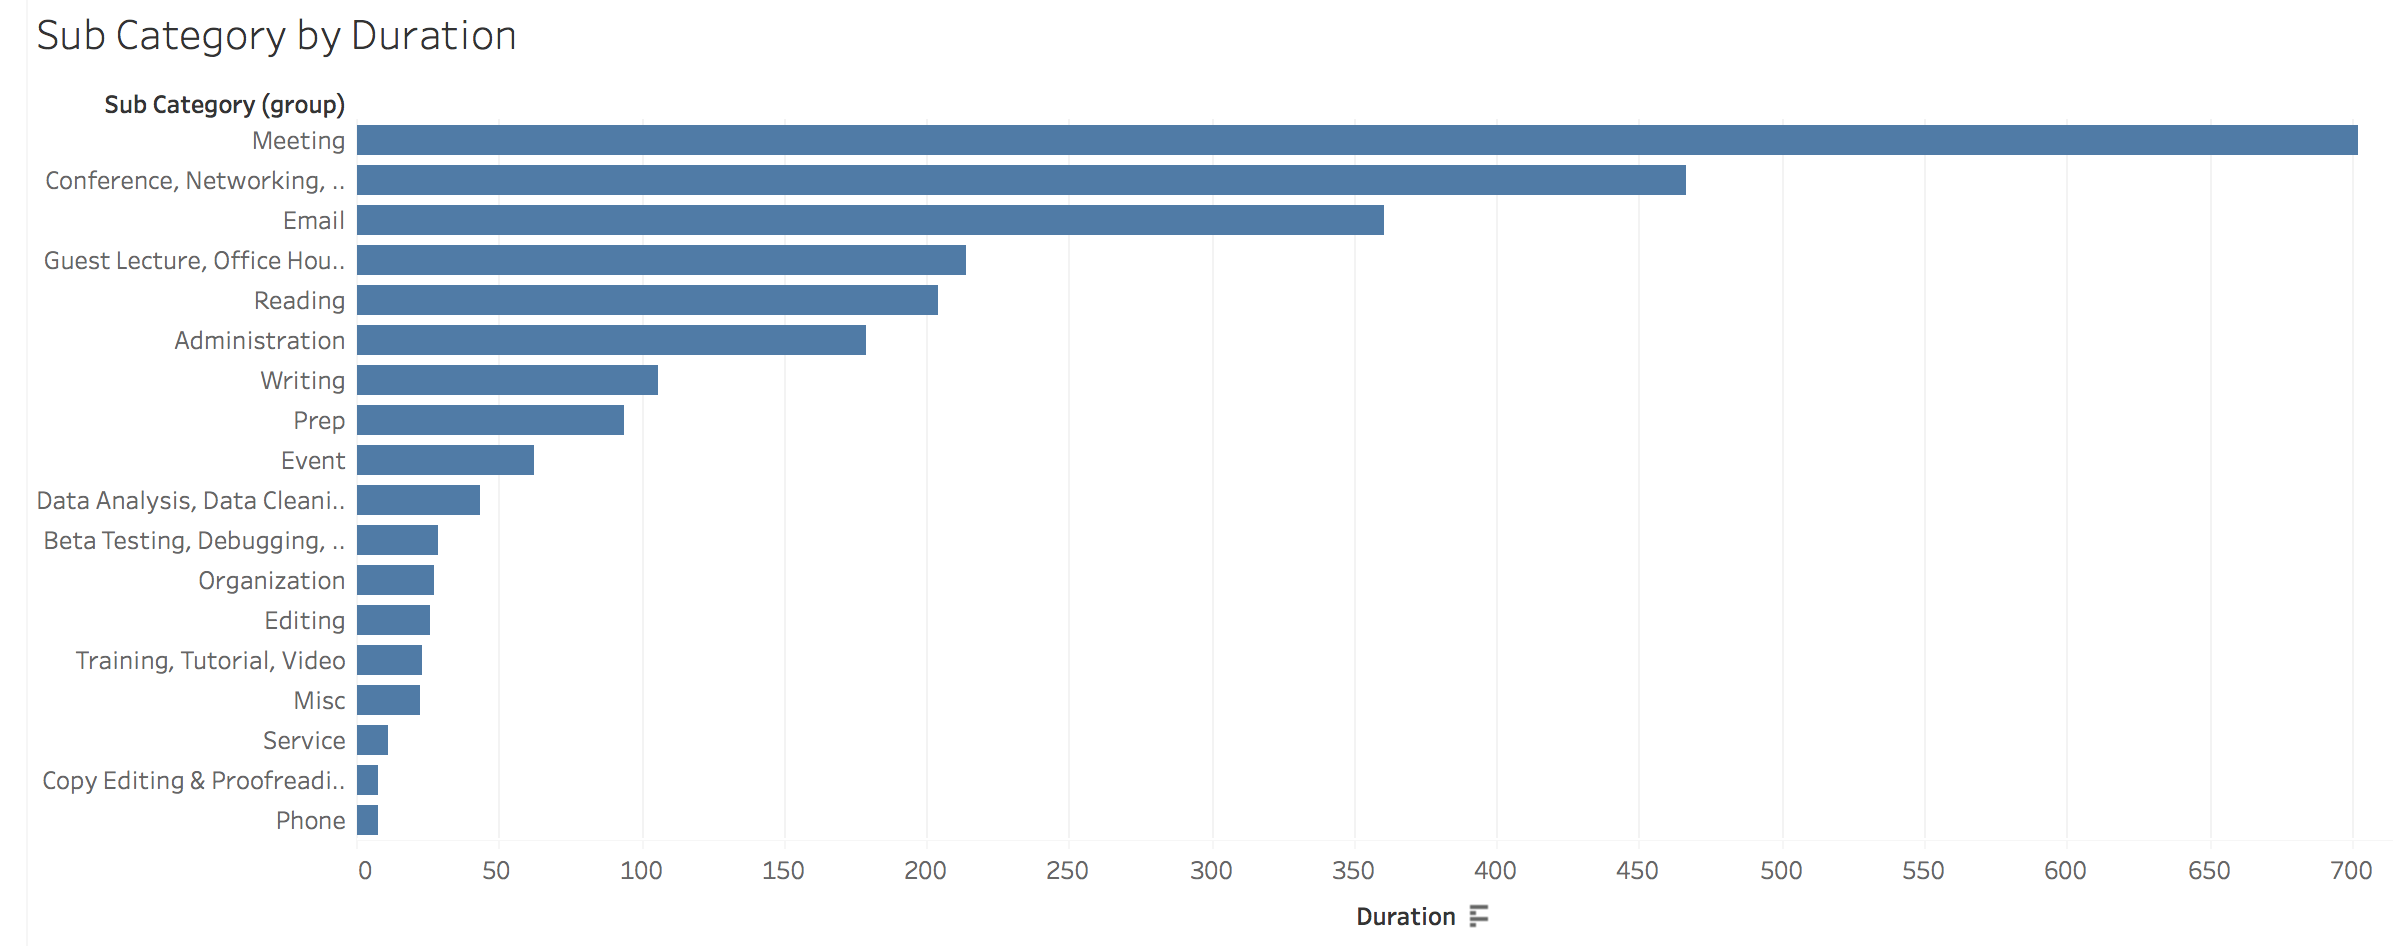
By far the majority of my time was spent in meetings, at 22%, followed by 15% of my time spent at conferences and networking/performing outreach. You can really see my communications preferences as well – I spent 11% of my time emailing people, making it the third highest sub-category, while phone communication barely squeaked onto the visualization. Guest lectures and consultations total 7%, while administration (aka filling out paperwork and creating/documenting center workflows) is only 6%. That last stat really surprised me because it felt like so much more of my job! Then again, that translates to 178.8 hours of paperwork, so it was a significant effort despite its low percentage.
Take-Aways
There are a number of different conclusions that could be drawn from this data, but the ones I would highlight are
- This job enabled me to maintain a very good work-life balance.
- While my flexible working hours were essential to being able to work continuously through my health problems, I did the majority of my work during a regular 8am-4pm workday. That said, I also did significant work on weekends and evenings.
- I spent 1/3 of my time on research and professional development. Not all library jobs have a significant research component, but many of them do, especially in institutions where librarians have faculty status.
- Most of my research time was dedicated to collaborative digital project work and I didn’t manage to carve out as much personal research time as I would have liked. That boils down to my personality, specifically prioritizing external collaborative deadlines over self-imposed personal deadlines.
- Because of the intensively collaborative nature of my work, I spent a lot of time in meetings and emailing people. A lot of time.
At the end of the day, CMU Libraries was an awesome place to work and a great career move for me. It played to many of my strengths while giving me significant flexibility in terms of when and where I did my work. So for any PhD job-seekers who’ve made it this far and feel like this might be the kind of position for them, I’d highly encourage you to check out the CLIR-DLF Postdoctoral Fellowship Program, which seeks to provide PhDs with practice experience in libraries and an entry into library-based careers. And for the rest of you, I hope this peek into the world of librarians was interesting and gives the digital humanists among you some ideas for future collaborations with a librarian on a campus near you.