This is an edited version of a lightning talk I gave at the Shakespeare Association of America Folger Digital Tools (Pre-Conference) Workshop. 
In March of 2019, Meaghan Brown of the Folger Shakespeare Library came to George Mason University’s campus to run an encode-a-thon with the upper-level undergraduates who were students in my Early Modern England course.
For this event, we were working on the Elizabethan Court Day By Day dataset, compiled by Marion E. Colthorpe. While the origin of this project was an attempt to track Queen Elizabeth’s royal progresses through the countryside over the course of her reign, it morphed into a dataset tracking the events of her court for ever day of her 44-year reign. It includes not just a list of events but also select quotations from a wide variety of primary sources.
 This dataset was donated to the Folger Shakespeare Library as a massive PDF. At over 2000 pages long, it’s a treasure trove of information about the peregrinations and events of Elizabeth’s reign. The Digital Media and Publications team at the Folger have extracted the information from the dataset into plain text and have been working to encode it, to facilitate future analyses of the data.
This encoding is done in a modified version of the Folger’s Dromio TEI transcription/collation tool, developed by Mike Poston, for Early Modern Manuscripts Online transcribathons. Students begin by entering their name or the alias by which they would like to receive credit – I hear rumors William Shakespeare is quite active on the platform! Then they choose a month of Elizabeth’s reign to begin encoding and land in the interface pictured below.
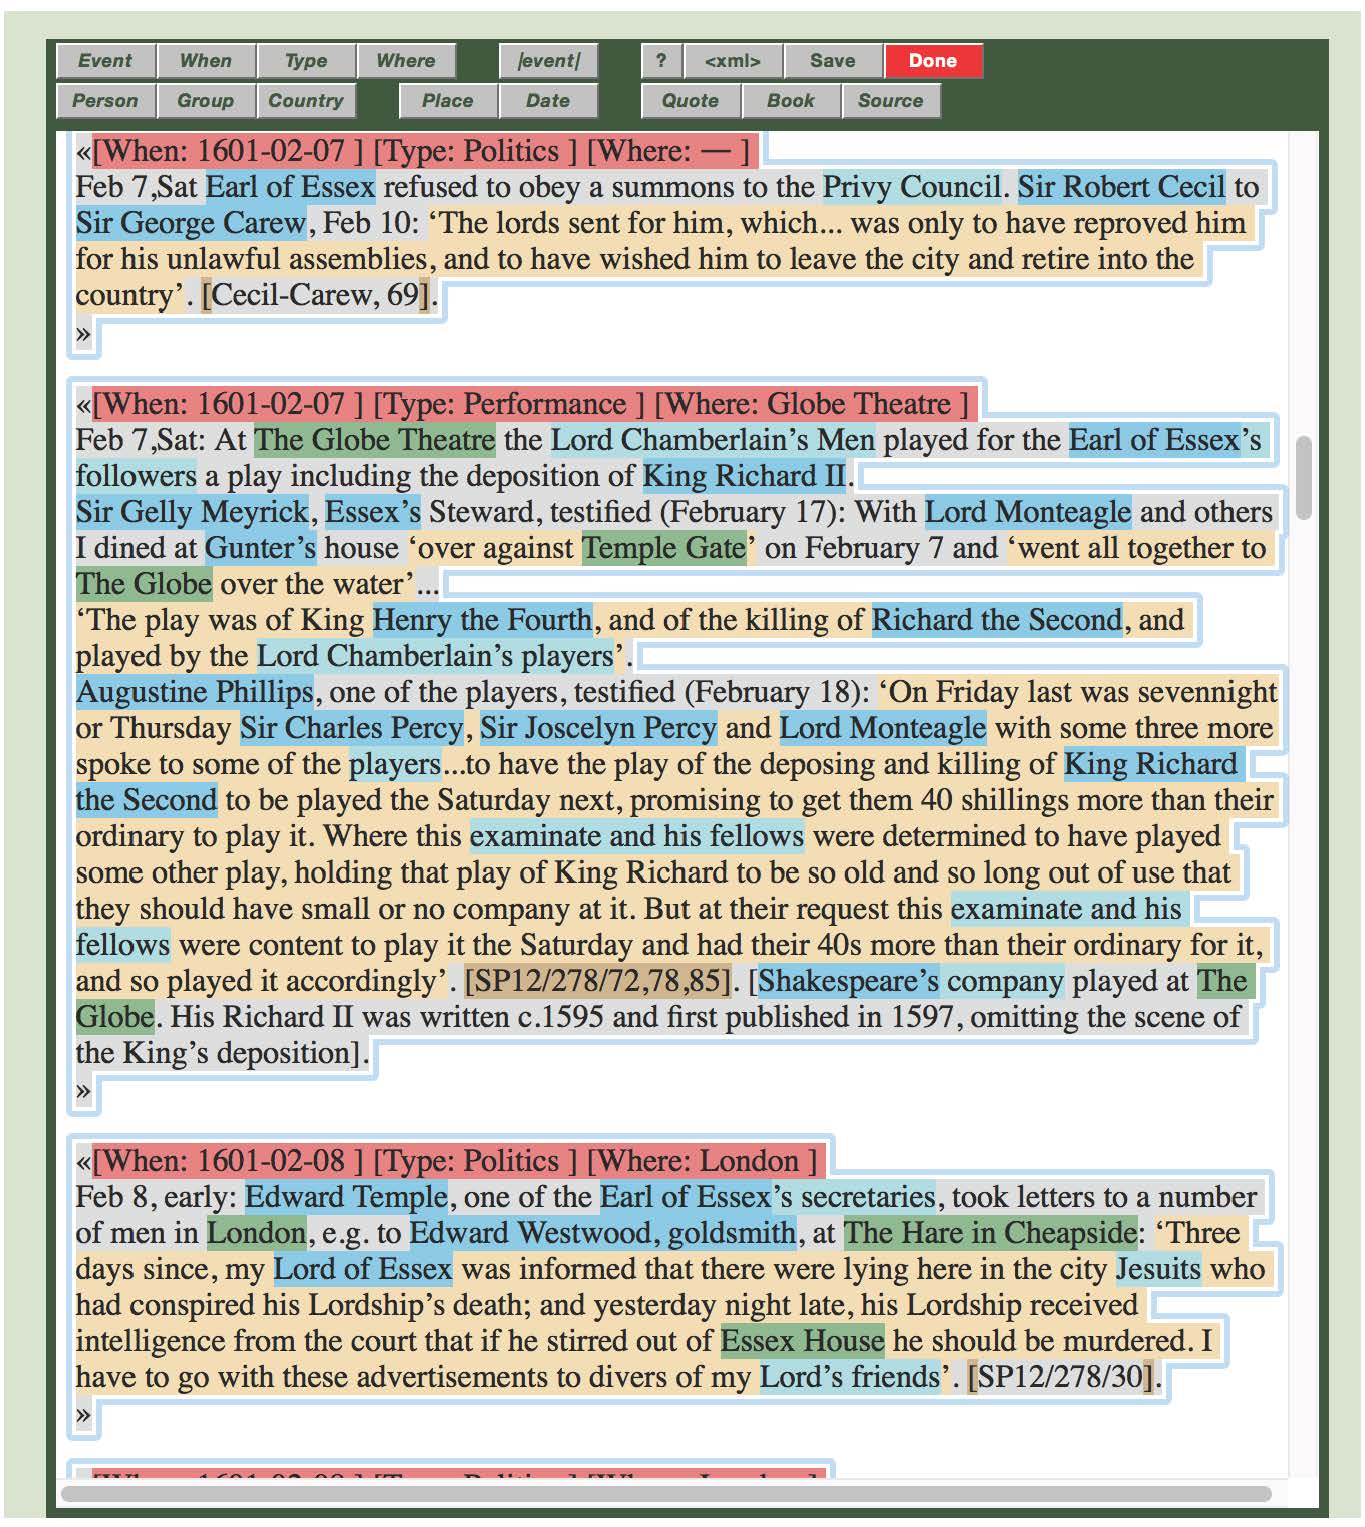 The first line of each day is metadata (colored red in the image to the right) where participants record the day, the type of event that has been captured, and the location of the event (where known). This particular month is February, 1601, chosen as the dates for the Earl of Essex’s rebellion – there are two events on the 7th and one on the 8th. While I wasn’t certain where Essex was when he refused to obey the Privy Council’s summons (politics), his followers were definitely at the Globe Theatre later that day, when the Lord Chamberlain’s Men performed Richard II (performance), presumably to get them in the right headspace for their attempted rebellion! The events of the 8th were somewhere in London, per the text, but at multiple locations within the city, hence the location is recorded at a larger scale than the single building of the Globe.
After adding (or editing some of the automatically generated) metadata about each day, students then marked up each day’s text by highlighting important words/phrases and clicking the buttons at the top of the interface to designate them as people (individual people, groups of people, or countries acting as people such as “Spain invaded”), places, dates, quotes, books, or general sources. While straightforward enough for a novice human encoder, this isn’t a task that can be done automatically for a lot reasons. For example, Essex is a person, a county, and also (in conjunction with the word “House”) a building in London.
 Most of my students worked solely in the interface, but a significant minority also flipped over into the XML markup view and dealt with manual tags, especially when they were dealing with days that needed to be split into multiple events or other complicated encodings. As someone who is personally familiar with XML, this view was in a lot of ways easier for me to work with as I could see very clearly when I’d accidentally gotten a tag in the wrong space or included a space in a place tag, or other “messiness” that I know will have to be processed out in the final analysis of the dataset.
While my students weren’t entirely certain, going into the event, how exactly this “encode-a-thon” thing was going to relate to their other classroom experiences, when I briefed my students after the event, they identified a number of positive outcomes they’d had from the activity:
- up-close and personal look at daily life among Elizabethan elite and their servants
- humanized historical actors
- looking at “raw data” of facts/events that forms historical narratives
- variety of sources used to reconstruct narrative of events
- coverage of major events that didn’t make it into the classroom narrative due to in-class time limits
- work behind building historical datasets
- critically think about categorization of events/activities
- introduction to XML (advanced students only)
And, perhaps most importantly, in between them regaling me with the stories they’d uncovered – and linking those stories back to important points I’d made in class lectures and their assignments – they reported having fun.
