2023 Website Update and Forthcoming Publications

To every thing there is a season… and while I still do love the theme I picked out when I originally moved my website to WordPress, even I have to admit that it’s showing its age a little bit. And I don’t just mean in terms of aesthetics. While the theme amazingly has stayed functional through dozens of major WordPress updates, it hasn’t been updated in <cough, cough> years and there were no guarantees it was still secure.

So, without further ado, I present to you my new, updated website appearance.

While I’m doing an announcement blog post, I figure this is also a good time/place to mention that numerous publications that have been clogged up in the pandemic publishing pipeline have finally started to appear in print:

And last, but never least, By the Numbers, my long-awaited monograph on numeracy and quantitative transformations in early modern England is coming out from Oxford University Press at the end of the year. ETA: It officially comes out January 4, 2024 with pre-orders shipping mid-December 2023, so I hope to be showing off physical copies at AHA 2024 in San Francisco.

So it’s time to say, so long 2010s, old website, and the pre-COVID world. Here’s to the Roaring (20)20s and may things continue to look up from here.

screenshot of original website design showing white text boxes on a yellow background and a header photo of people waiting in line to enter the British Library

Rise and Fall of the DHSI Twitterati?

NOTE: This is a lightly edited version of a talk I gave at the inaugural Chesapeake DH 2020 conference. My original intention was to wait to publish this until after June, to see if the trends I’d identified continued through this year’s DHSI. But the disruptions of the COVID-19 pandemic and the subsequent cancellation of pretty much everything have created enough of a rupture in the dataset that I’ve decided it is not advisable to extend my analysis past 2019.

TL;DR – people have wondered if DHSI Twitter is dying. I hypothesize, based on my analysis, that it is not dying so much as democratizing. First, we saw an explosion of Tweets as the network expanded to encompass more than a clique of early adopters (2014-6), then we saw a contraction as many Twitterati moved on or moved into the instructor corps (2017-9), leaving more “space” in the network for everyone else.

Rise and Fall of the DHSI Twitterati? A Longitudinal Analysis of the Digital Humanities Summer Institute Twitter Hashtags from 2012-2019

Digital humanists have been using Twitter to share their experiences at the annual Digital Humanities Summer Institute since at least 2009 and Twitter has become a staple of the DHSI experience, with official hashtags, organizer accounts, and a variety of prizes awarded to prolific or entertaining tweeters.  But beginning in 2018 and again in 2019, people noted the decreasing volume of DHSI tweets, with one user speculating this might be “finally the turn away from twitter“.  While it’s a bit soon to toll the death knell of DHSI Twitter—800 people wrote over 5000 tweets on the #dhsi19 hashtag—the absolute numbers do seem to tell a simple tale of an increasing number of people tweeting in the early part of the decade, which peaked in 2015 and 2016 and has been in decline ever since.  However, these absolute numbers are a mask for series of more complicated patterns.  This talk looks at DHSI Twitter from 2012 through 2019, examining the changing institutional circumstances of the institute, the expansion and fragmentation of the initial tweeting clique, and the role of power-tweeters (or “Twitterati”) in developing and sustaining DHSI Twitter.

I’m going to skip any detailed discussion of method and instead point you to my Twitter Methods Ur-Post if you’d like to read about data collection and processing. While I collected most of this data myself, I’d also like to give a shoutout to Jon Martin for collecting and sharing the first years in this dataset.

graph of 2017 DHSI tweets per day showing spikes during the two working weeks of DHSI

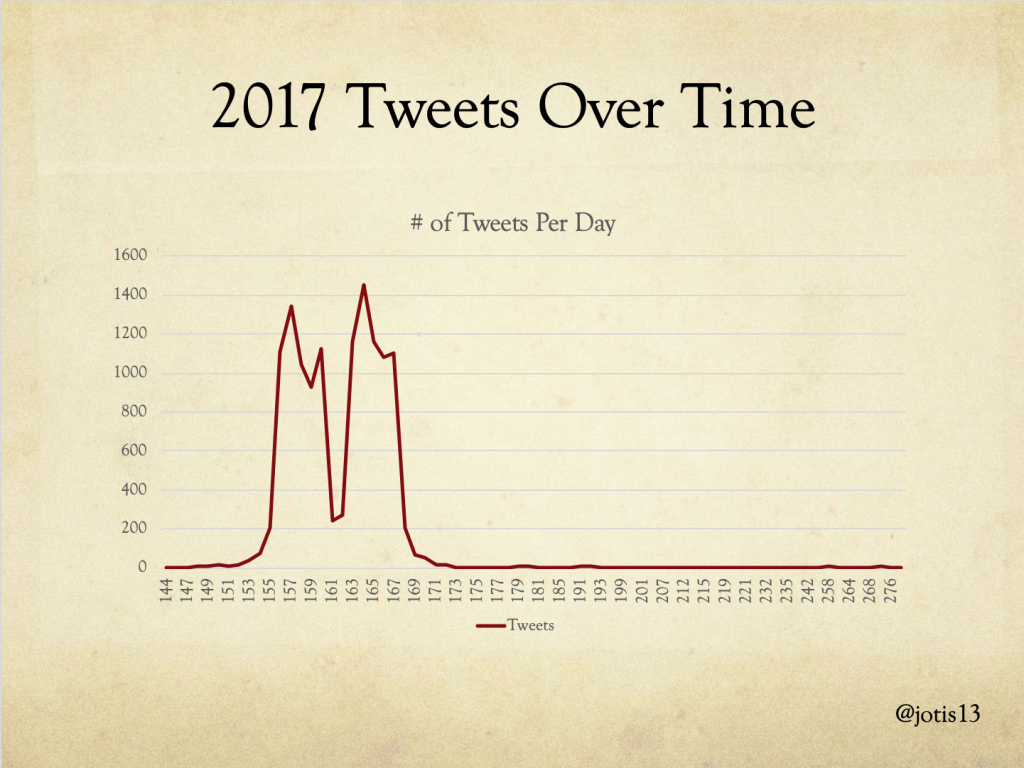
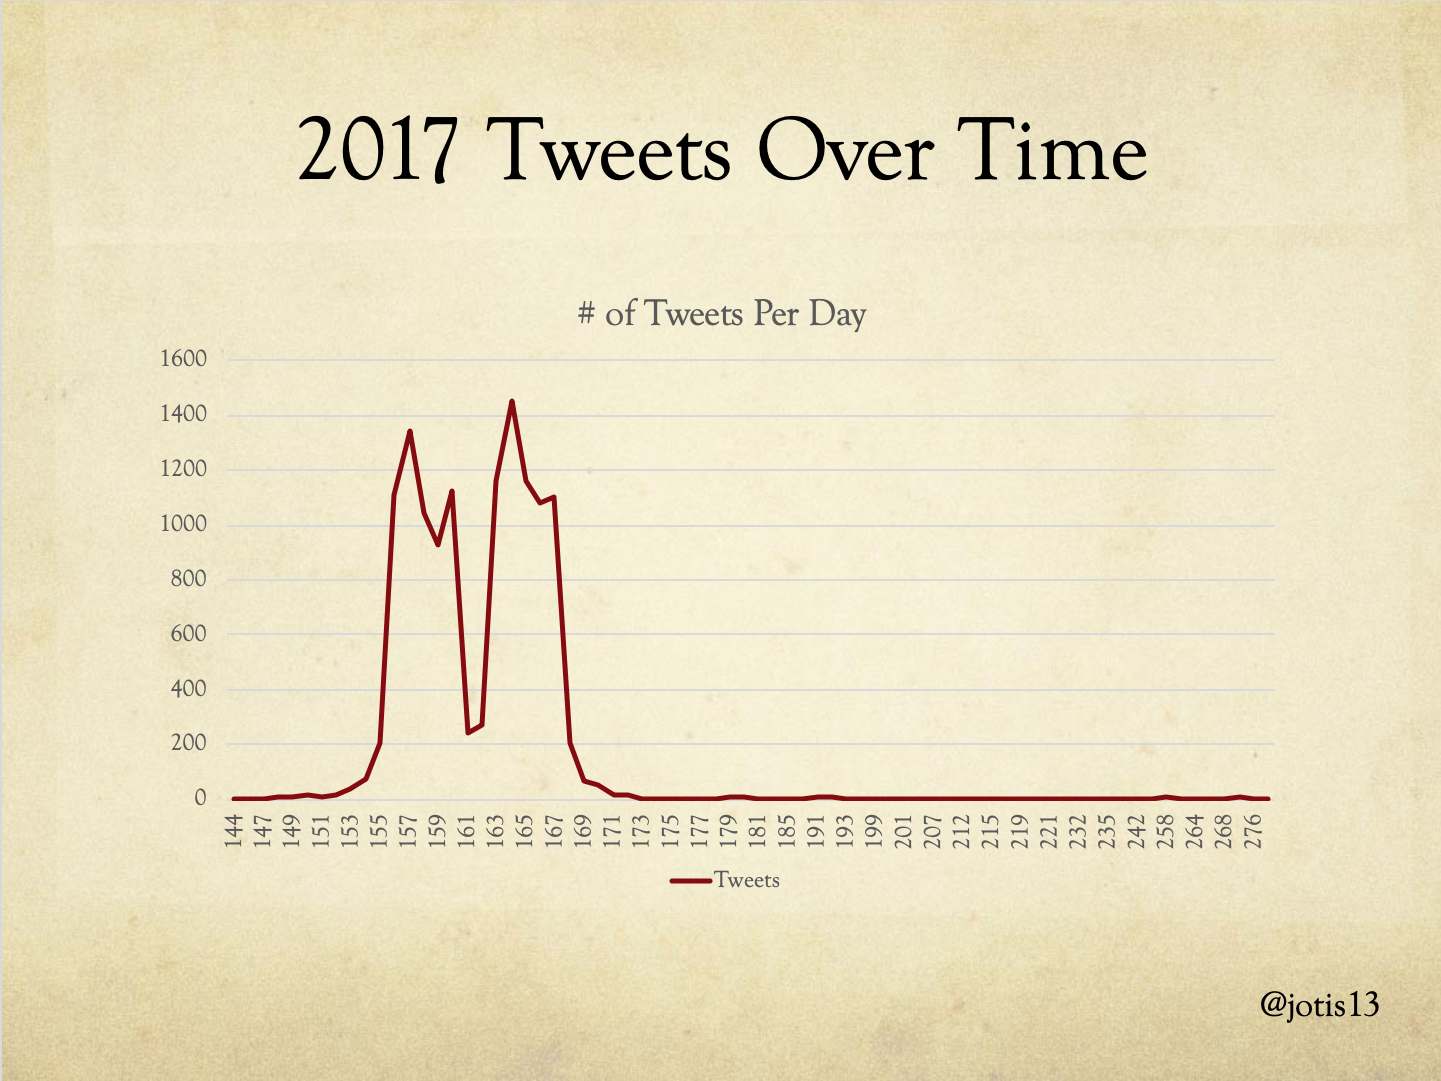
While I’ve collected Tweets over varying lengths of time, you can see from this graph the number of total DHSI tweets in 2017 that there is a sharp increase in number of tweets before the event and an equally sharp decline after the event, which made me comfortable cutting off long tail of tweets before and after DHSI without fear of missing too much.

close up of 2017 DHSI tweets per week, demonstrating Mondays as highest tweet days, falling a bit on Tuesday, Wednesday, Thursday, a spike on Friday, then a dramatic decrease into the weekends

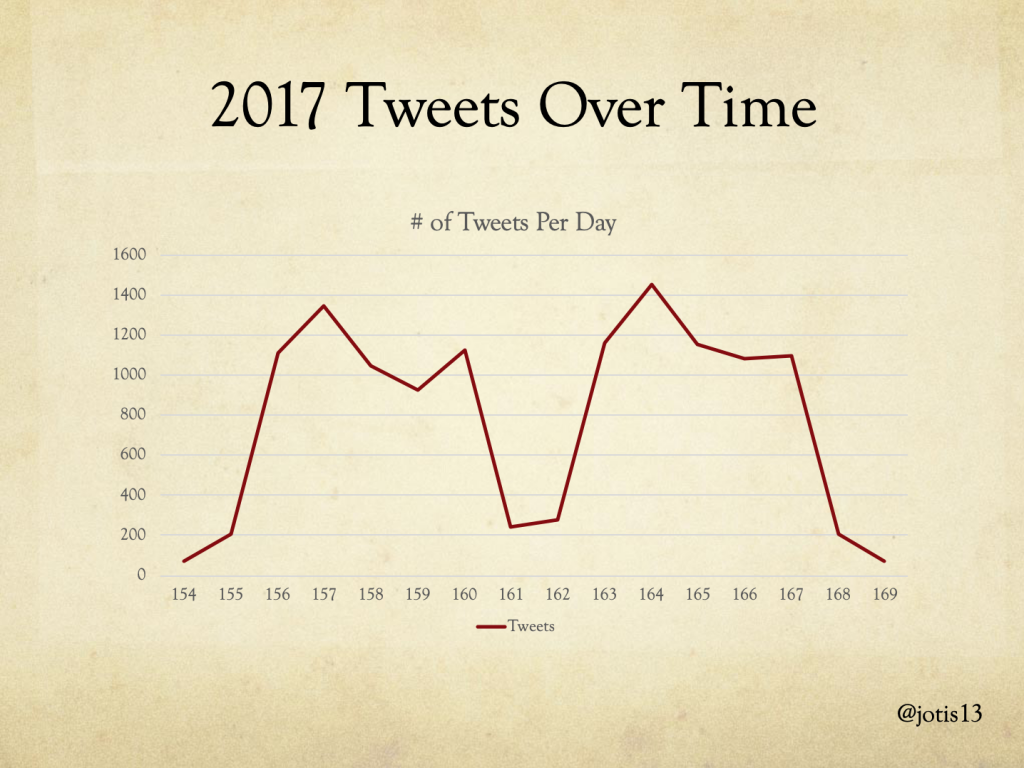
This is a visualization of +/- 2 days for 2017 so can see boundaries more clearly. In general, there is a pattern of a sharp uptick in the number of tweets in the first three days of each week – as people are traveling, then excited to be at DHSI – followed by a decrease over the next two days – as people are getting stuff done – with a bit of an uptick on the last day – as people give one last hurrah and declare the week was fun. There’s a sharp decrease over the weekend between the two weeks of DHSI, and an equally steep drop off at end of the entire event. Because of this, I feel comfortable focusing on the primary dates of each year’s DHSI, plus or minus 1 travel day (e.g. for 2017 this would be days 155 to 168 in the visualization above).

graph of total people tweeting at DHSI, showing peak in 2015-6 and slow decline afterwards

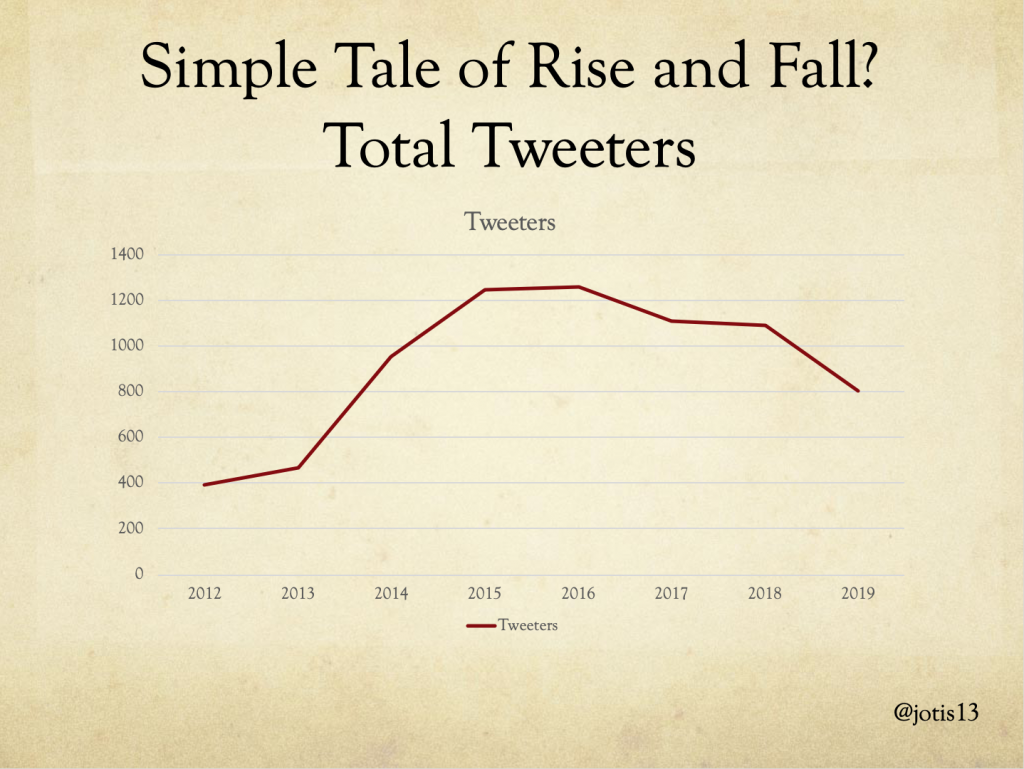
With those preliminaries out of the way, on to the fun stuff! If you look at the total number of people Tweeting at DHSI, concerns about decrease in Twitter activity seem correct if perhaps a little overblown. There’s a steady decline in 2017, 2018, with sharp drop off in 2019, less than any year since 2014, but who knows what 2020 would have looked like under other circumstances.

graph showing tweets per week at DHSI, showing going from 1 to 3 weeks in 2015 and 3 to 2 weeks in 2016, with tweets per week falling dramatically in 2015, rising again to 2017, then falling again after

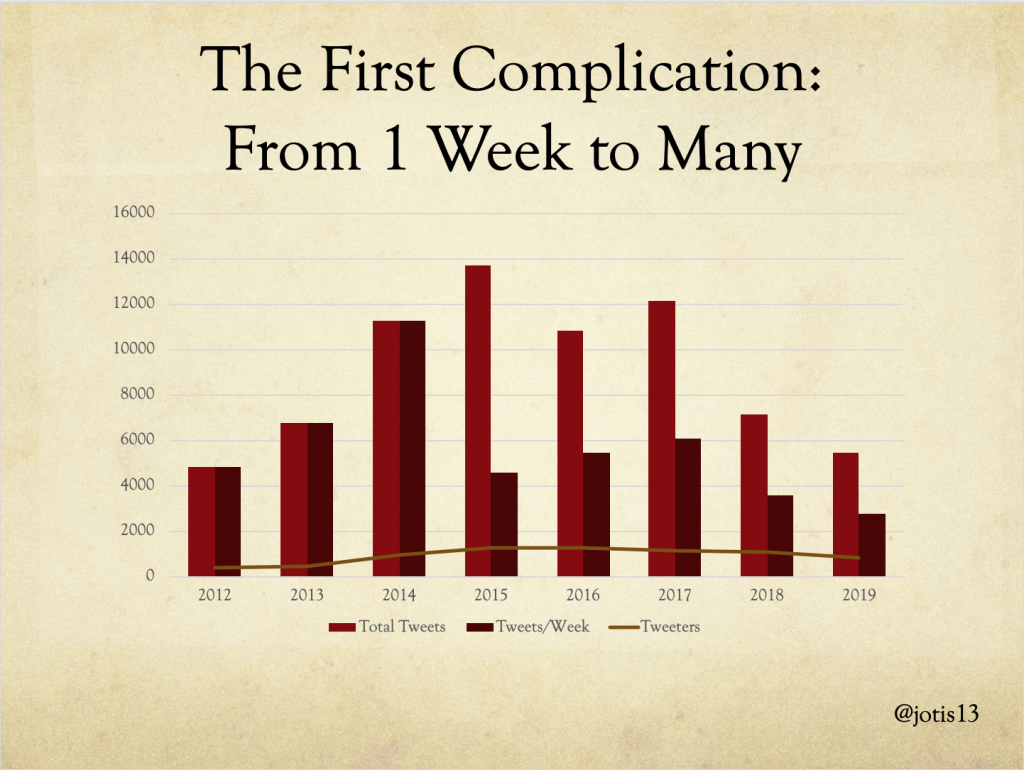
If we look at total number of Tweets, we get the same tale but perhaps more starkly. There is a peak in 2015, fewer Tweets in 2016, a slight recovery in 2017, and a sharp drop off in 2018 and 2019 which take us back down to the level of 2012. The sharp drop in 2018 all the more remarkable for the fact that total number of Tweeters was relatively steady from 2017 to 2018 – there were 20 fewer people but almost 5000 fewer Tweets!

But if we look at second bar in this chart – which is Tweets per week – we see the first complication in this simple narrative. In this column, the sharpest drop-off was actually between 2014 – the last year DHSI was 1 week only – and 2015 – when DHSI attempted to expand to 3 weeks in a grueling marathon. While this might logically have been expected to produce a threefold increase in Tweets, attendees report severe burnout and the institute was scaled back down to 2 weeks for all subsequent years.  Indeed, burnout remains an issue and attendees are warned against it annually.

The total tweets per week recovered a bit in 2016 and 2017, but never reached heights of 2014.  By that standard, DHSI Twitter has been dying since 2014.

graph of number of Twitterati tweeting 100+, 100-199, and 200+ tweets over time, showing spikes in all three categories around 2015 and a spike in 200+ tweets in 2017

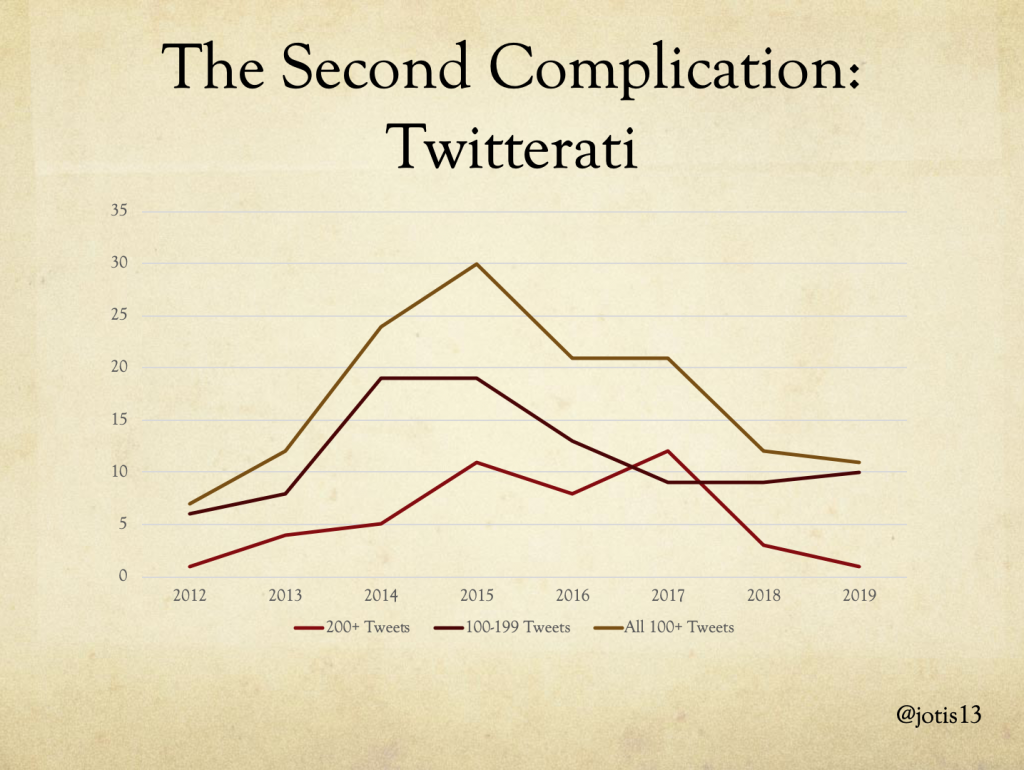
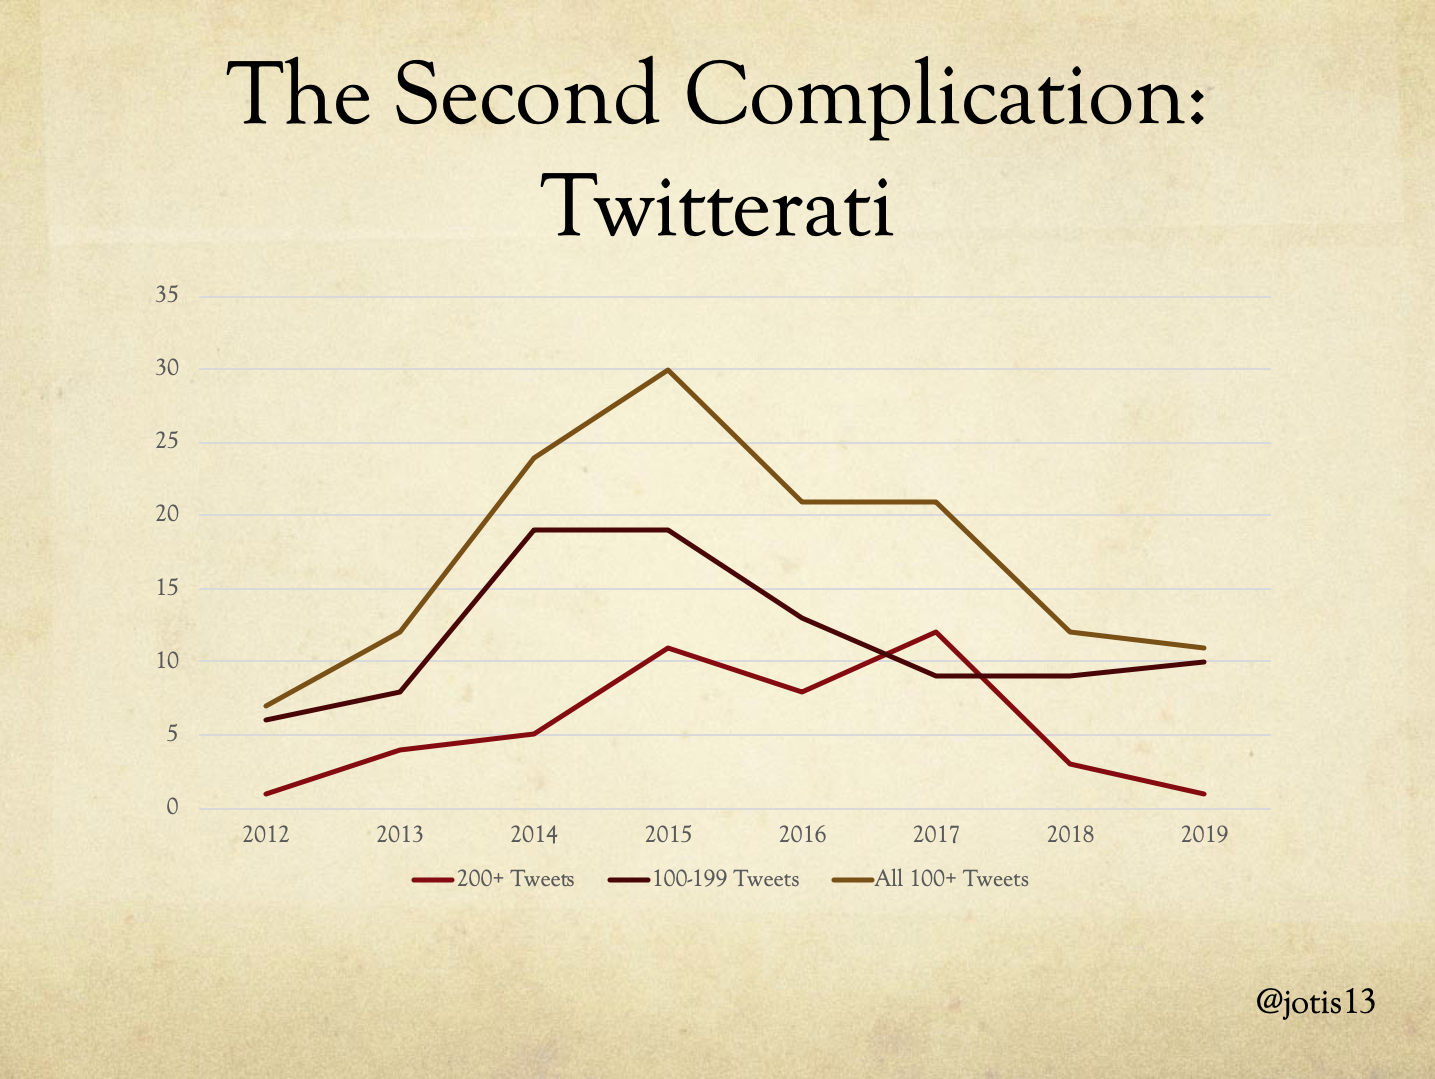
The second complication emerges when we look at a subset of the DHSI Tweeters, who I like to call Power-Tweeters or the Twitterati: people who Tweeted more than 100 times during any year of DHSI. To reach the status of Twitterati, a person has to produce 20+ Tweets a day if they only attend 5 days, or 9+ Tweets a day if they attend 2 weeks as well as the weekend in between. I’ve mapped here all the Twitterati, as well as subdivided the group into people with 200+ Tweets and people with 100-199 Tweets. (Note that, while 200 is the minimum number of Tweets to be in the first group, some people in that group are Tweeting 400, 600, even 817 times in a single DHSI.)

There aren’t many people who made it to 200 tweets when DHSI was only 1 week and we see the number of Twitterati in this category double in 2015, when the event went to 3 weeks followed by a decline in 2016 when the event was scaled back to 2 weeks.  The number of Twitterati in the 100-199 saw its biggest increase a bit earlier, in 2014, and its biggest decrease also in 2016.  But the number of Twitterati in this group have actually been holding steady since 2017, with even a slight increase into 2019.

This is in sharp contrast to the 200+ Twitterati. There was a spike in their numbers during 2017 followed by a huge drop off to 2018.  In 2017, the twelve 200+ Twitterati were responsible for 3741 Tweets, but in 2018 the three 200+ Twitterati barely managed 781.  In other words, 3000 of the 5000 Tweet difference between 2017 and 2018 can be accounted for by the decreased activity of this group.  The trend continued into 2019, when only one person who managed to make it over 200 Tweets, and they barely squeaked over that line at 216.

So when it comes to the forces driving the overall number of DHSI Tweets, it seems clear that what we’re seeing is a drop in the number of Twitterati.  While there’s also been a drop in the overall number of Tweeters, that seems more closely correlated to the drop in attendance at DHSI from 2018 to 2019.

chart of DHSI tweets over time reading: year # weeks # participant-weeks # tweeters # tweets avg # of tweets/week # ppl w/200+ tweets # ppl w/100+ tweets # of “power-tweeters” associated event 2012 1 388 393 4790 4790 1 6 7 - 2013 1 433 470 6786 6787 4 8 12 - 2014 1 558 954 11250 11250 5 19 24 - 2015 3 719 1248 13672 4557.3 11 19 30 - 2016 2 743 1258 10854 5427 8 13 21 ELO/ INKE 2017 2 833 1109 12146 6073 12 9 21 SHARP 2018 2 879 1089 7158 3579 3 9 12 DLF/ SINM 2019 2 790 808 5450 2725 1 10 11 ADHO SIG Pedagogy

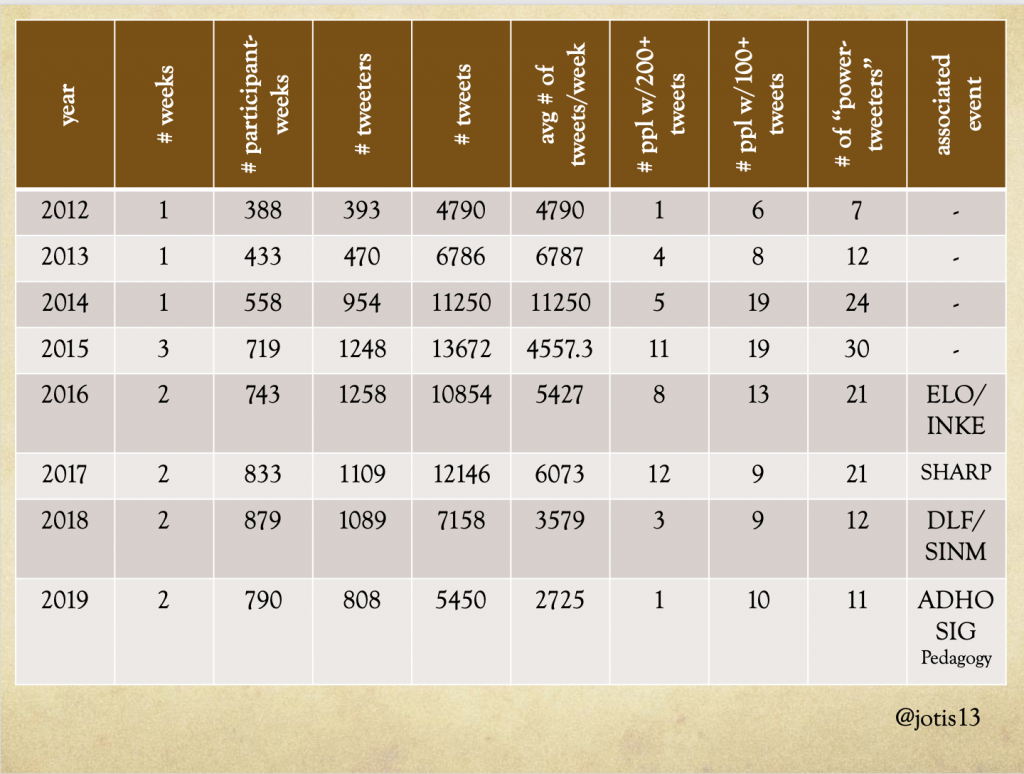
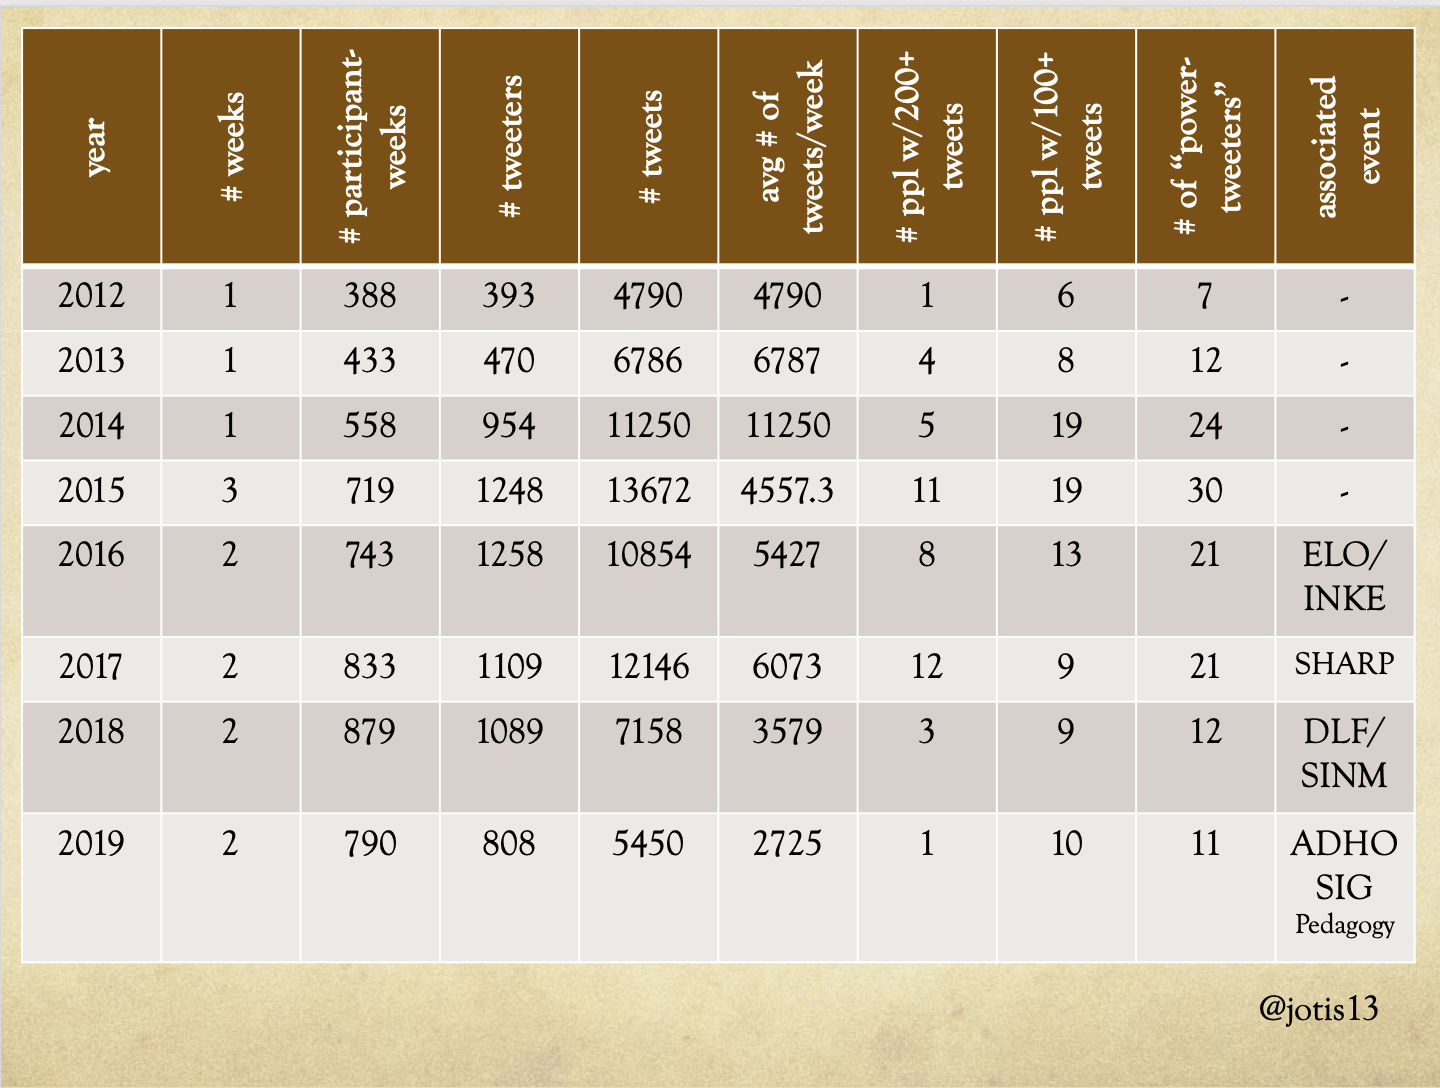
For those who are interested in the numbers, here’s the chart where you can can see how Twitterati correlate to number of Tweets and the sharp drop off in both for 2018 and 2019. It also shows the changing overall attendance numbers for DHSI. (Note that this column counts people twice if attended both weeks and uses public registration lists to determine attendance so it is not 100% accurate but close enough for our purposes.)

In this chart, you can also see a third possible complication that might be driving some of these numbers, which is the weekend conference.  While the ADHO Sig Pedagogy and DLF events were great, those were also offshoots of a scholarly conference that happens at other times of year (the international DH conference and the DLF Forum, respectively).  By contrast, 2017 was the year that SHARP held its one and only conference in conjunction with DHSI.  And SHARP is another event that has historically been filled with Tweeters, with Twitter prizes and attendees who were paid to live-Tweet the conference in multiple languages.  So a lot of what is driving the anomalous numbers in 2017 can actually be pinned on SHARP and SHARP’s Twitterati.

force-directed network graph that is too big for anyone to get much information out of

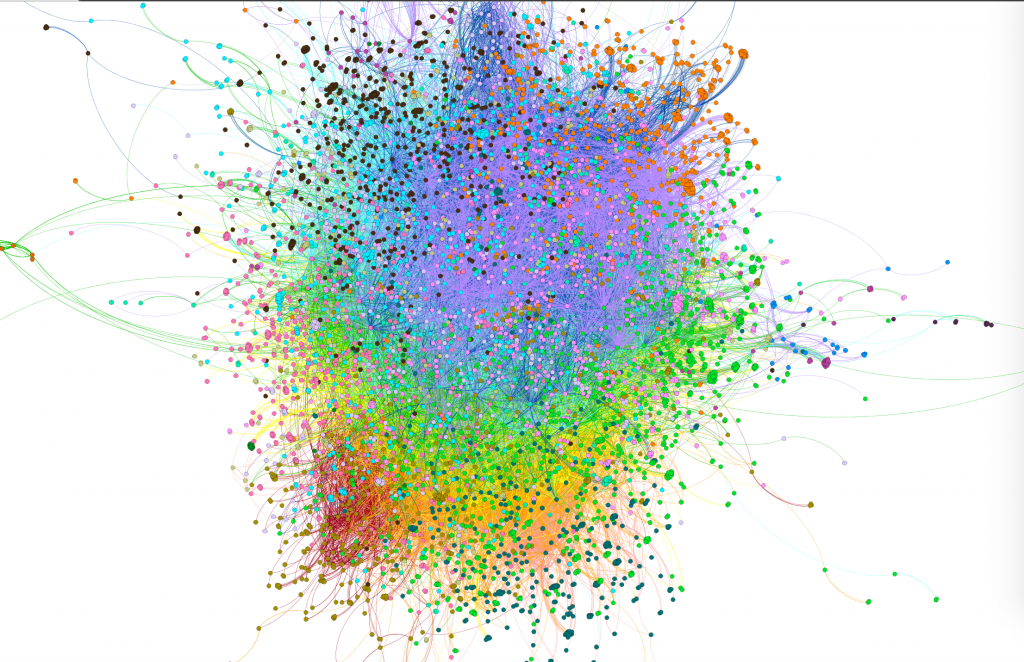
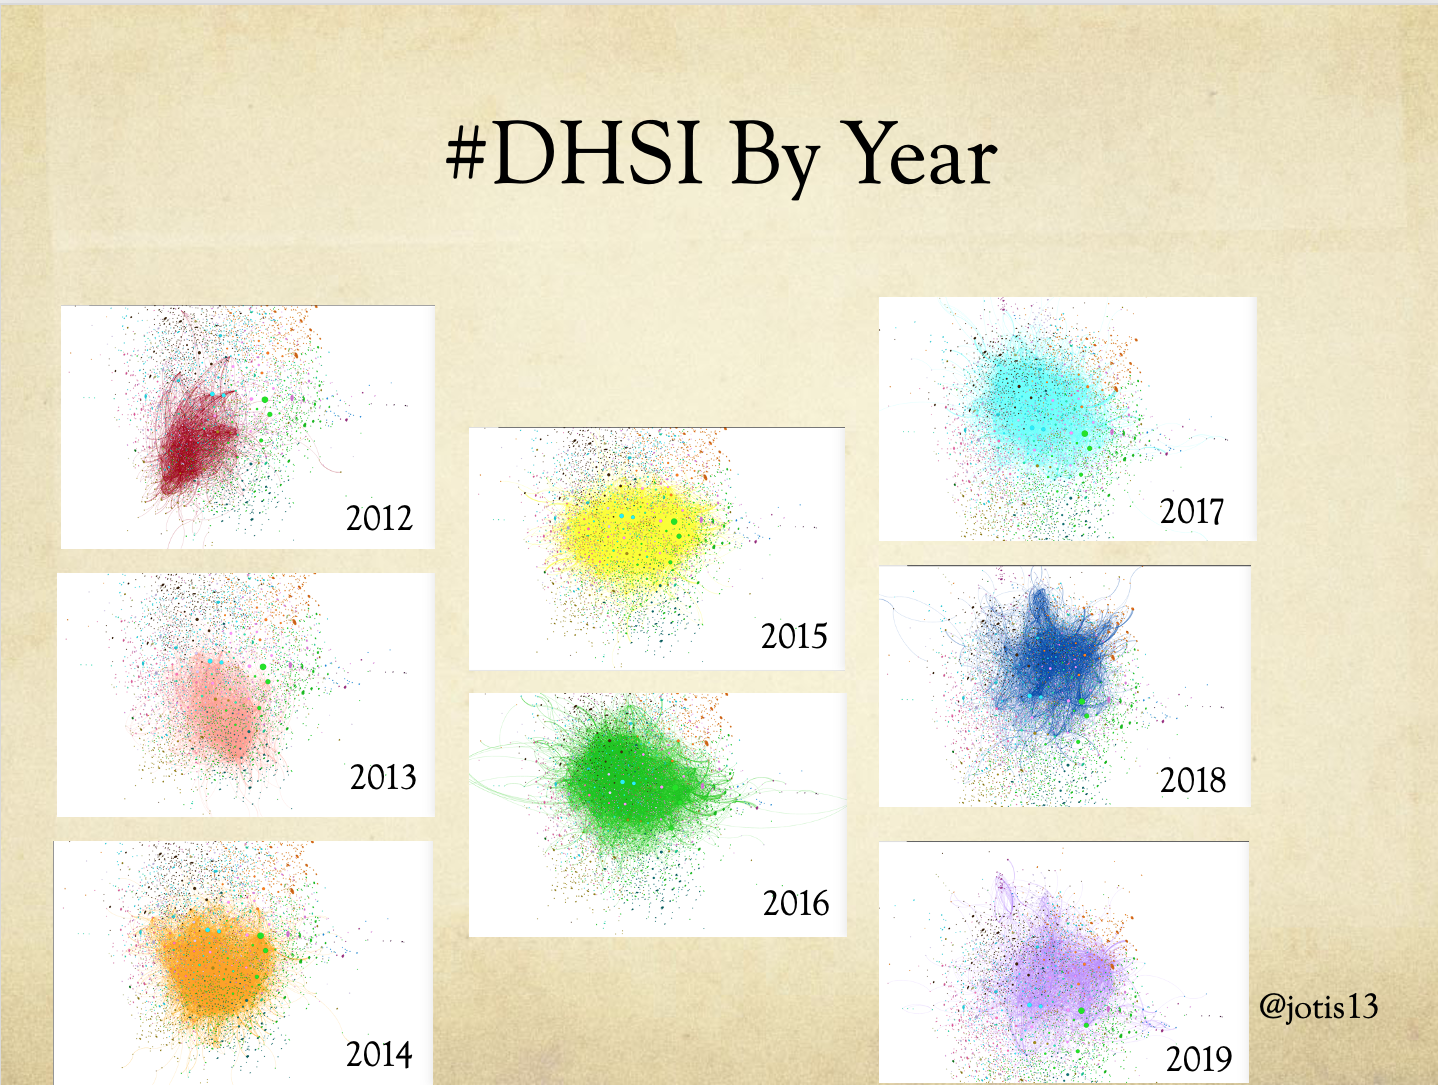
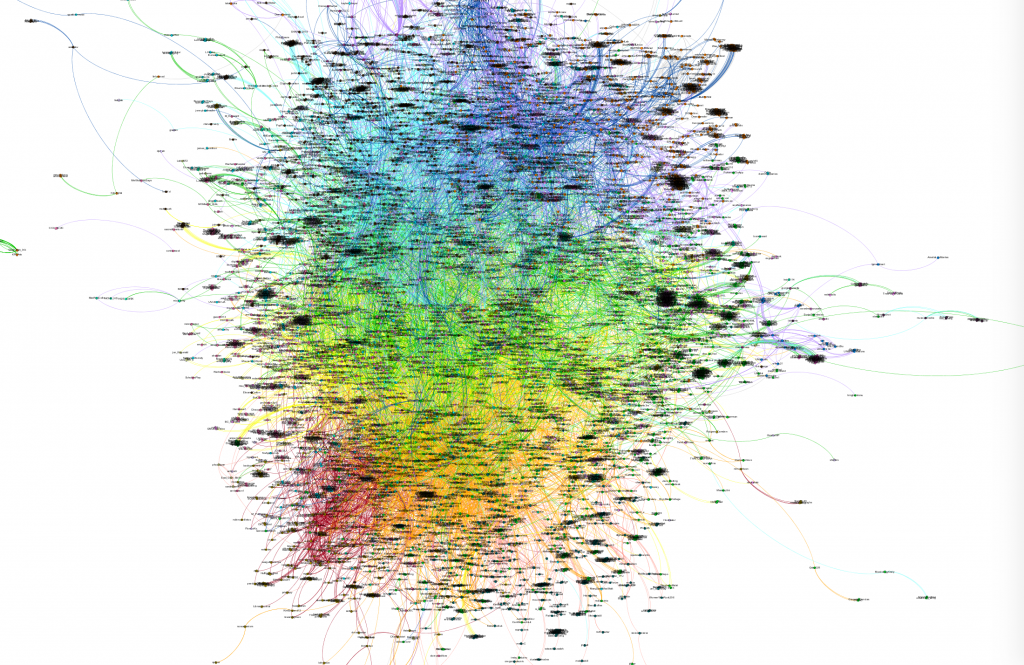
At this point, we’ve seen a few complications to our original, simple narrative, and hopefully I’ve intrigued you about the role of Twitterati at DHSI. Now it’s time to move onto… the super-network!  Here is a visualization of the entire DHSI Twitter network from 2012-2019. It has 6539 nodes and 69594 edges (the red edges are 2012, orange is 2013, through to purple which are 2019 edges) in 43 connected components, of which 98.1% of nodes and 99.84% of edges are in the giant connected component.

close up view of force-directed network layout, still too difficult for most people to read but with a few Twitterati names popping out for those with sharp eyes

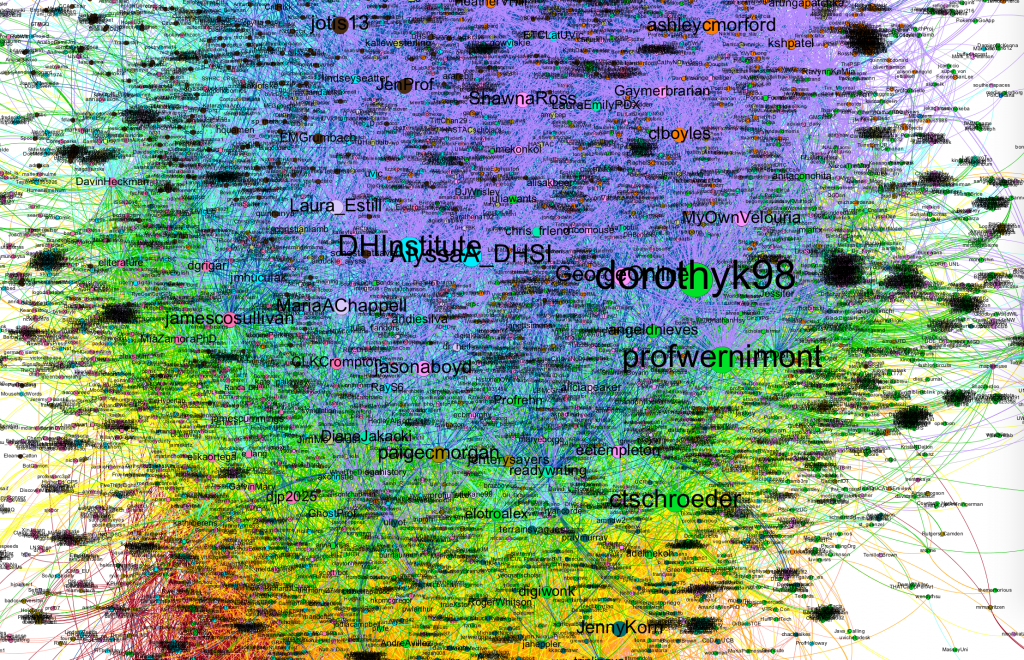
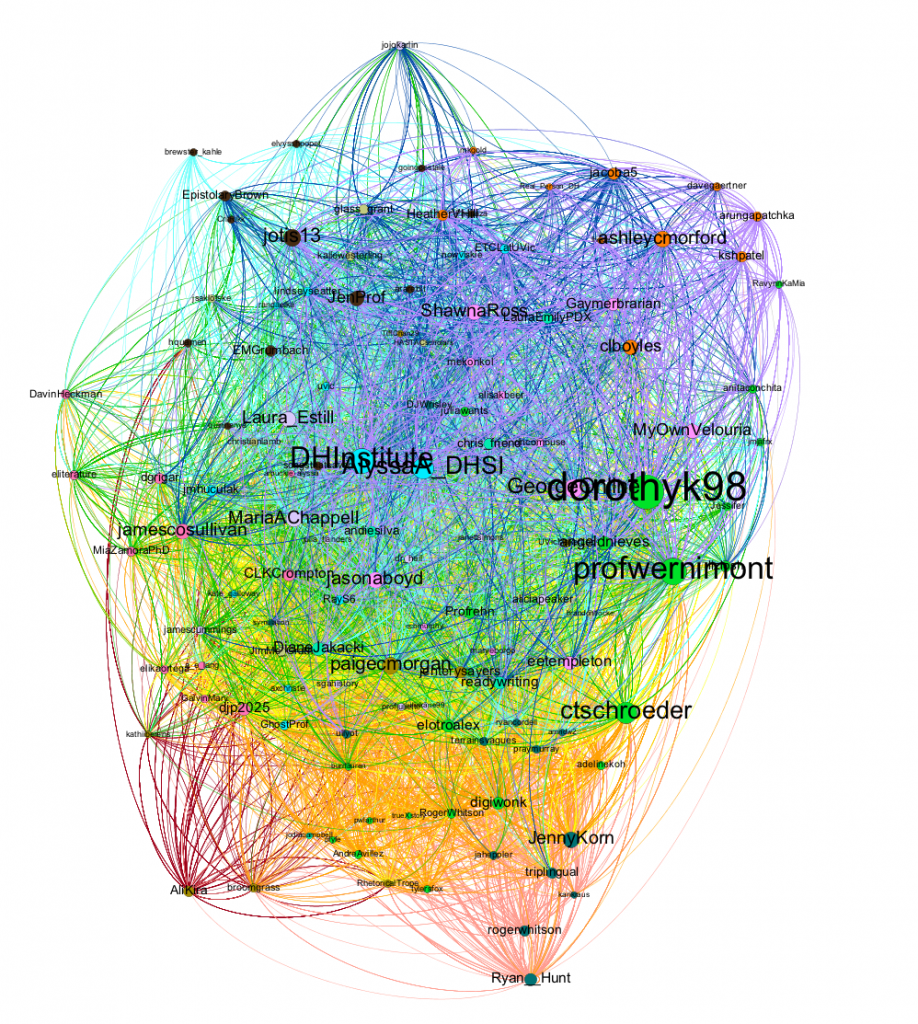
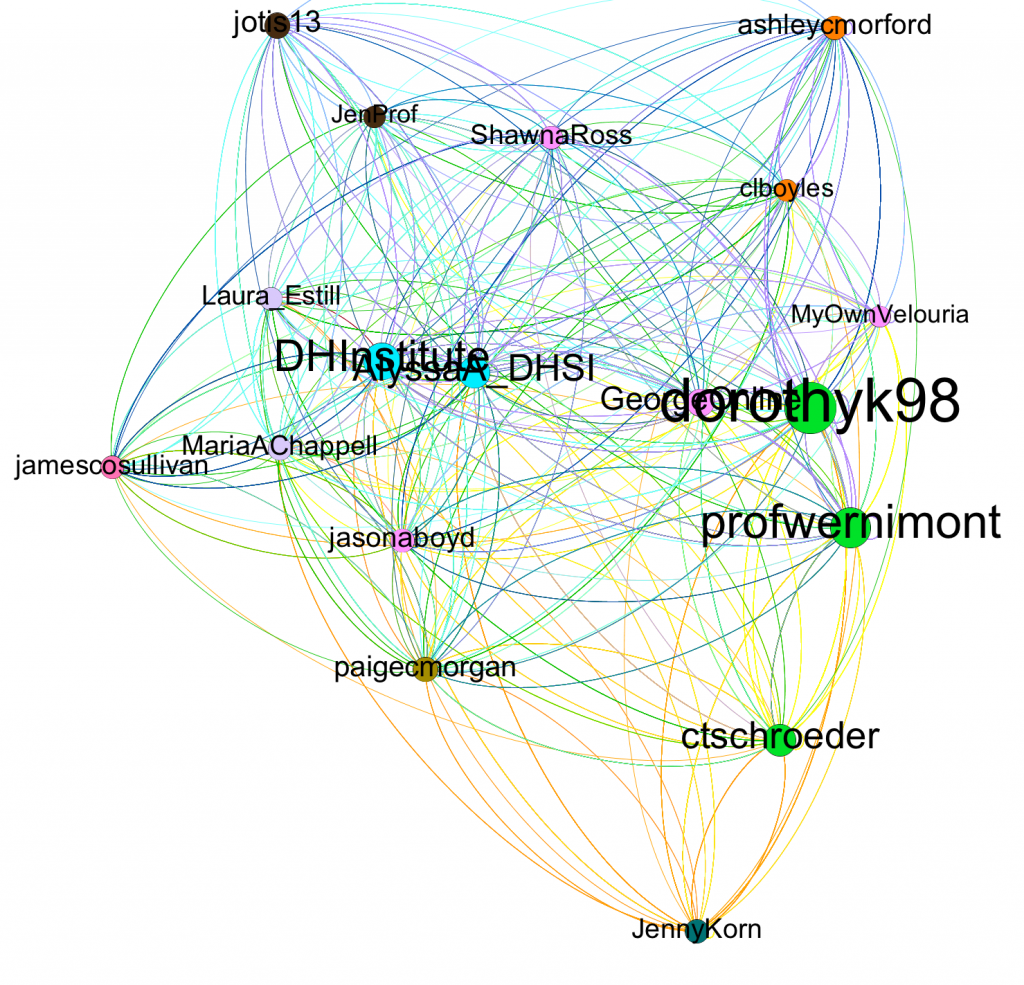
And because network visualizations like this are always spaghetti monsters, here’s a slightly closer view, with nodes sized by degree – the number of times the person with that Twitter handle Tweeted or was Tweeted to/about – and colored by modularity class – algorithmically generated subnetworks. From here, you can already begin to see some of the Twitterati’s handles pop out, such as dorothyk98, profwernimont, DHInstitute, and AlyssaA_DHSI. I’m hanging out in the upper left hand corner. But this visualization also begins to let you see the sheer number of people who’ve attended and tweeted at DHSI over the years and how little the network has shifted over time. That is, there are no clear subnetworks, where each year emerges as an independent cluster of nodes.

small multiples of a force-directed network graph showing the overlap of people attending each year of DHSI

You can see that a bit easier here, with each year separated out in the visualization. If you look closely, you can see there has been some drift over time:

  • the red 2012 nodes are mostly to the bottom left of the combined visualization
  • the pink 2013 nodes are to bottom right with some 2012 overlap
  • the orange 2014 nodes are in the center and low bottom with significant 2013 overlap
  • the yellow 2015 nodes are in the center with significant 2014 overlap
  • the green 2016 nodes overlap most of 2015 and are a bit higher in the visualization
  • the teal 2017 nodes overlap 2015 and 2016, but are a bit off to the left/top
  • the dark blue 2018 nodes overlap 2017, but are a bit off to the right/top
  • the purple 2019 nodes overlap most of 2015-8 and are a bit lower in the center

This is consistent with many people coming to DHSI for several years (mostly in a row) then stopping when no longer need training. Alternatively, they move into the instructor pool and stop Tweeting as much or stop Tweeting altogether because they’re too busy instructing.

Separating them out also lets you see the year Twitter really “caught on” was between 2013 and 2014 – the numbers of Tweeters and connections doubled, while the density of network halved.  That is, this was no longer a tight clique of a few Tweeters but lots of people sharing the hashtag space.

chart: year # weeks # participant-weeks # nodes # edges connected components graph density avg. degree avg. path length associated event 2012 1 388 488 3623 4 .015 7.424 3.181 - 2013 1 433 647 5479 4 .013 8.468 3.185 - 2014 1 558 1244 11758 6 .008 9.452 3.292 - 2015 3 719 1603 13358 9 .005 8.333 3.281 - 2016 2 743 1629 11070 8 .004 6.796 3.404 ELO/ INKE 2017 2 833 1531 10573 23 .005 6.906 3.464 SHARP 2018 2 879 1309 7691 14 .004 5.875 3.537 DLF/ SINM 2019 2 790 1032 6042 16 .006 5.855 3.556 ADHO SIG Pedagogy

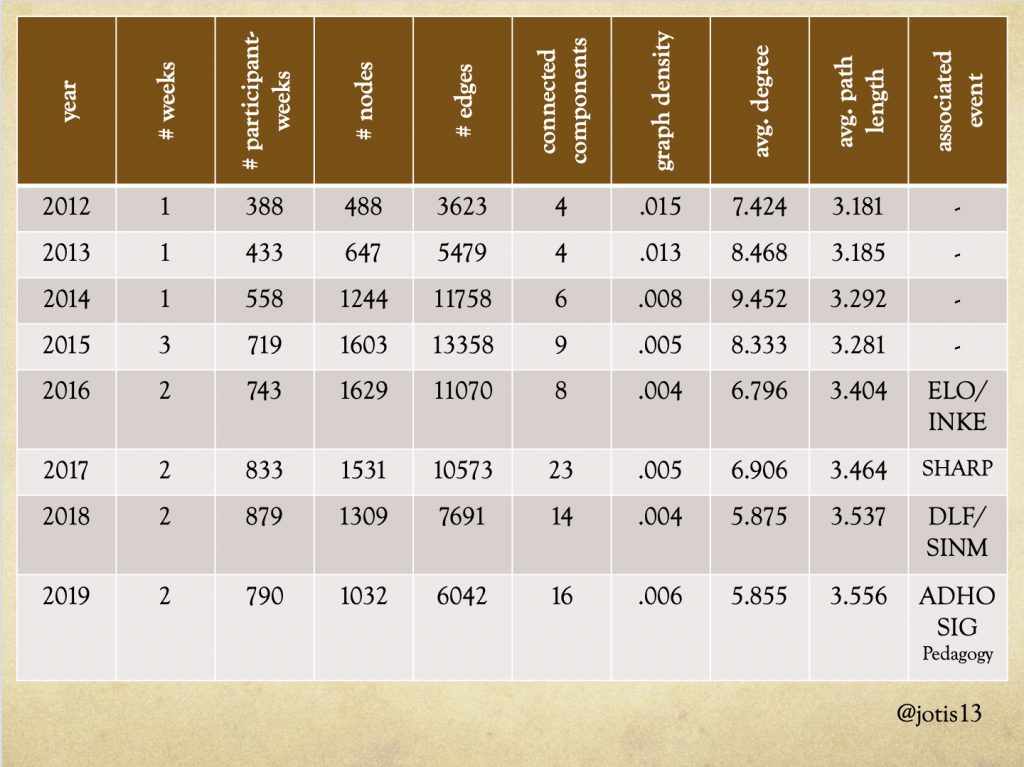
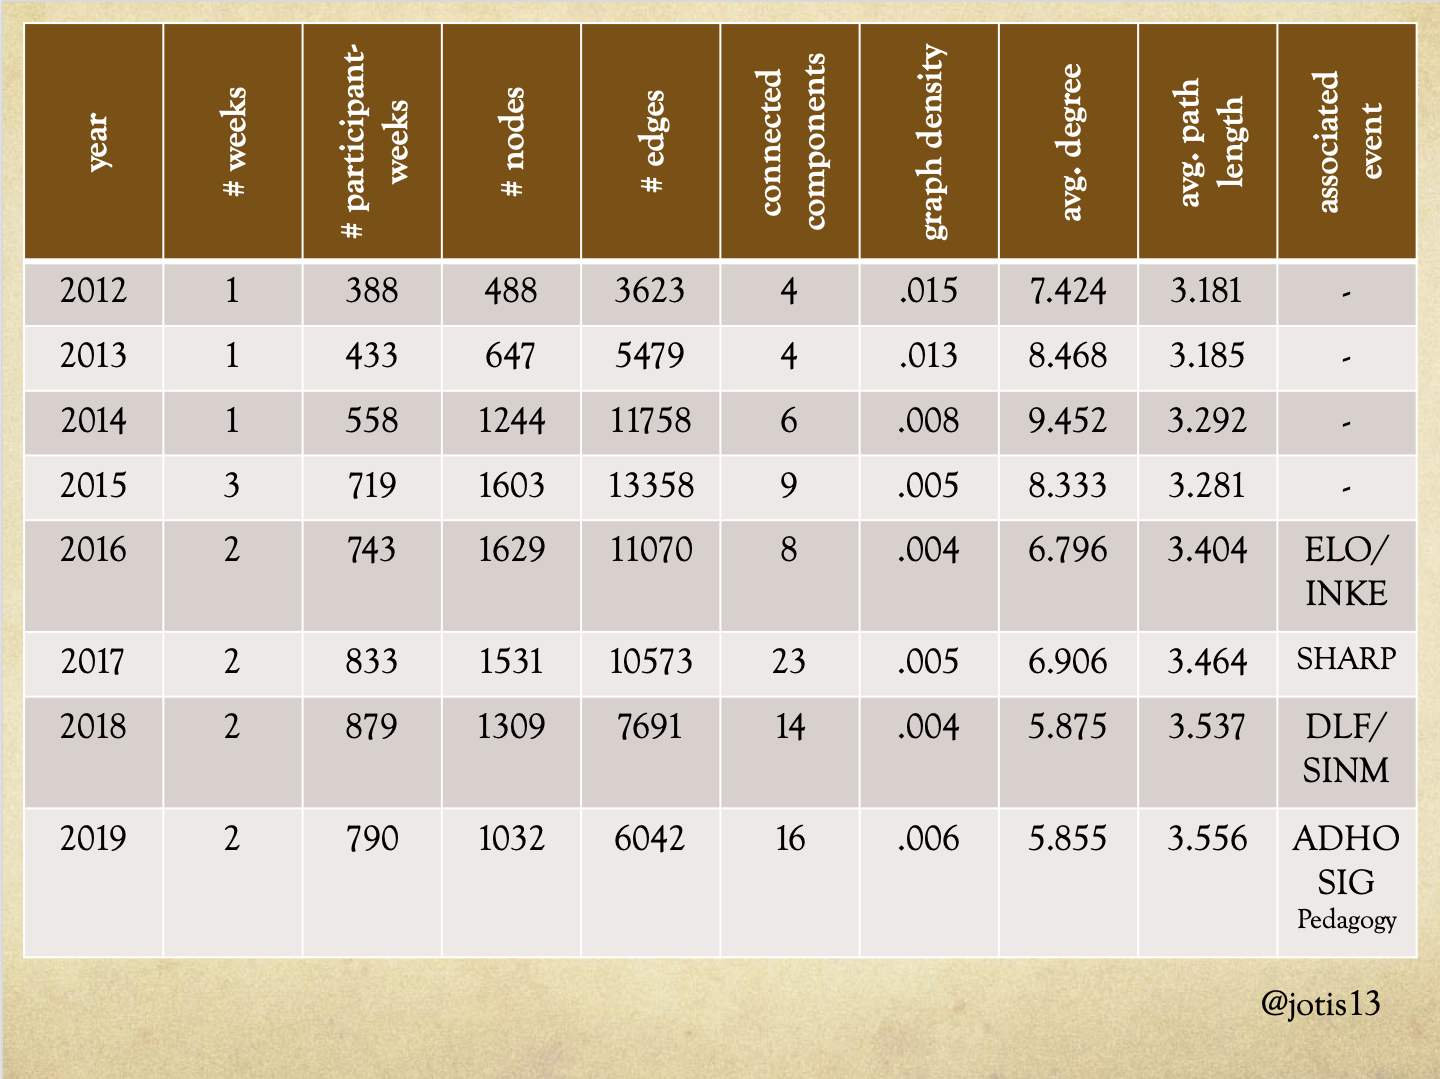
These are statistics on the network for each year’s DHSI. I know force-directed graphs are prettier than charts, but this chart lets us start to get into the meat of the network analysis, for example by showing you the changes I was just talking about between 2013 and 2014 more clearly.  Far from 2014 being the year DHSI Twitter started to die, from a network analysis standpoint 2014 is the year DHSI Twitter finally caught on.

Moving forward in time to examine the two years where DHSI’s format changed dramatically – going from 1 to 3 to 2 weeks – we see the slow evolution of the Twitter network and how it only partially reflected those changes. There was a slight increase in Tweets/connections from 2014 to 2015, but it wasn’t proportional given the move from 1 to 3 weeks.  We also see the graph density continue to decline, which makes sense: people attending only week 1 might not Tweet to those in week 2 or 3. The number of Tweeters increased from 2015 to 2016, and the number of overall connections decreased but again, it wasn’t proportional given the move from 3 to 2 weeks.

2017 stands out as an anomalous year in the network analysis as well. The number of Tweeters and connections decreased slightly from 2016 to 2017 but the number of connected components tripled. The average degree and density also increase a little, suggesting that SHARP attendees’ participation in the DHSI Twitter network both (slightly) increased the connectivity of its main connected component while at the same time fragmenting parts of it into far more numerous unconnected components.

In 2018, the number of Tweeters and connections both decreased markedly – as people were noticing on Twitter – but the number of Tweets actually declined at a much faster rate than number of connections. Again, this gives support to the hypothesis that these changers were driven by the Twitterati decreasing in numbers. People were still using Twitter to connect to each other, even if they weren’t producing as many tweets. Similarly, the number of Tweeters decreased markedly from 2018 to 2019 but the number of overall connections didn’t decrease in proportion to the decrease in the number of Tweets.

In other words, the DHSI Twitter network was still functioning as a network even though it seemed to have gone (relatively) radio silent.

force directed graph of DHSI Twitter without the Twitterati showing no large nodes but the vast majority of nodes/connections are still there

To consider the importance of the Twitterati another way, I first visualized the network without them. For the purposes of the DHSI “super network,” I defined the Twitterati more generously as anyone who has tweeted over 200 times at all DHSIs combined (so anyone who’s been at 3 or more DHSIs might get into the Twitterati even if weren’t in the Twitterati for any 1 year). This cuts out a mere 2% of the nodes but a whopping 75% of the edges.

Another way to think of this is to note that 36% of the DHSI Twitter network consists of nodes that are connected to it by 1 Tweet and another 17% are connected by 2 Tweets. In other words, the VAST majority of people connected to DHSI hashtags are the weakest of possible ties – 1 and done.  But these nodes share a quarter of the edges in the graph with each other and almost half the edges with the Twitterati.

force directed network graph of 123 Twitterati showing remarkable coherence over time

By contrast, the Twitterati themselves consist of 123 nodes.  That’s it. Only 2% of all nodes in the network have tweeted 200 or more times over this 8-year period, and amongst themselves they generate a bit under a third of all the edges.

force directed network of a few people who have tweeted over 1000 times at DHSI

So where does this leave us as I cram in the last few words before I’m out of time?  There is a very, very small number of people responsible for the vast majority of DHSI tweets, and if we zoom in to the 1000+ Tweets club, we can see how truly small a handful of people this is. There are 18 of them (well, us). Thus just a few Twitterati attending or not attending in a year (or, if you know who many of these pepole are, just a few Twitterati moving into the instructor corp!) can have an outsized impact on the network.

BUT ALSO, if you will allow me to return to an earlier visualization…

force directed graph of DHSI Twitter without the Twitterati showing no large nodes but the vast majority of nodes/connections are still there

…it’s possible what we have been seeing in 2018 and 2019 is not the demise of DHSI Twitter so much as the democratization of DHSI Twitter. Each year, there have been fewer and fewer Twitterati dominating the conversations, making space for everyone else. And that is as beautiful a network as the super-network I started with.  Thank you.

The Twitter Methods Ur-Post

For some years now, I’ve been analyzing conference Twitter data and sporadically posting about it online, including twitter threads written from various airports. While I’ve had a method from the beginning, that method has evolved over time: most significantly, I got tired of endless hours of Open Refine data cleaning and automated the network creation process. (To be clear: I love Open Refine. But when you have a tedious, repetitive task, programming is your friend.) While it’s possible that my methods will continue to evolve over time – as technology changes and new research questions occur to me – this is the current state of my methodology and will be linked as the ur-post whenever I blog about Twitter analysis.

Data Collection

I collect my data from Twitter using Hawksey’s TAGS 6.0, which employ Google Sheets. Yes, I know there’s now a TAGS 6.1 but I subscribe to the philosophy of “if it ain’t broke, don’t fix it.”

The primary advantage of TAGS, for me, is the ability to “set and forget.” TAGS utilizes the Google Search API (as opposed to the Google Streaming API) in its limited, free version, which means that it can only capture twitter data from the last 7 days. To get around this limitation, TAGS can be set up to query the API every hour and capture whatever new tweets occurred since the tweet “archive sheet” has last been updated. This means it can be set up whenever I remember to set it up – usually weeks if not months before a conference – and it will continue running until I remember to tell it to stop – again, usually weeks if not months after a conference ends.

I try to download this data regularly to my computer, according to the data management principle LOCKSS: Lots of Copies Keeps Stuff Safe. Only having the data available in Google Sheets makes me dependent on Google to get to my data. By contrast, CSV files on my computer, which is Time Machined in two locations, have a decent chance of surviving anything short of nuclear/zombie apocalypse.

Data Cleaning/Pre-Processing

While the data that I get from TAGS is relatively clean, I do tidy it up a bit first. Most importantly, I deduplicate my dataset. Some of this duplication is my fault, when I’m trying to track hashtag variants and someone includes both variants in a single tweet (e.g. “aha2019” and “aha19”). TAGS also seems to duplicate some of its collection data, though I haven’t figured out why – manual inspection of each tweet’s unique ID makes clear when a tweet is an actual duplicate in the set vs. a delete-and-rewrite or a retweet of someone else’s tweet. Because deduplication is a simple process of checking whether each tweet’s unique ID occurs only once in the dataset, I’ve automated that process.

Depending on the analysis I want to conduct, I also tend to time-limit my dataset. Specifically, I delete any tweets (from a copy of the spreadsheet – no one panic!) that occur more than one “day” before the start of the event or one “day” after the end of the event. In this case, a “day” is defined as the GMT day, which may or may not correspond to the local timezone of the event. While this has the potential to cause slight discrepancies when comparing events across timezones – specifically, some events will have a few more hours of data capture before the event starts while some will have a few more hours after it starts – I don’t believe these changes to be statistically significant. If I ever do some hard math on the question, I’ll update this post to indicate the results.

Network Creation

Now to the fun stuff! I started analyzing conference tweets because I was interested in how people connect and share knowledge/ideas/opinions in this virtual space. As such, my primary interest lies in creating a social network from the twitter data – who tweeted at/mentioned who – which necessitates transforming the TAGS archival spreadsheet of tweets into a network of Twitter handles (and/or hashtags). Because Twitter handles are unique IDs, I only needed an edge list of sources and targets for each tweet (other data capture was and remains interesting-but-optional).

I originally did this manually. Aside from being tedious, this also created problems for replicability. That is, what if I slipped up and missed or repeated something while creating my edge lists? I therefore wrote a Python script to do this work for me, with a few variants for if I wanted to keep the hashtag, date/time information, or for my students using TAGS 6.1.

Next I imported the edge list into Gephi (though I’ve experimented with other software, Gephi’s old hat to me at this point and does what I need it to do) and allow it to sum repeated edges to give each edge a weight. That is, if I tweeted to or re-tweeted @epistolarybrown 173 times over the course of a conference, the edge from me to her would have weight 173.

Network Analysis

At this point in the process, I use Gephi’s built-in algorithms to conduct my network analysis, usually with an emphasis on metrics like degree, betweenness centrality, network diameter/path lengths, and modularity classes. For an example of how that works out in practice, check out one of my conference blog posts! And if you have any questions, feel free to ping me via Twitter.

Code

All of my code is available on Github under a MIT License.

Coding Queen Elizabeth’s Court

This is an edited version of a lightning talk I gave at the Shakespeare Association of America Folger Digital Tools (Pre-Conference) Workshop. image of a poster created to advertise an encode-a-thon

In March of 2019, Meaghan Brown of the Folger Shakespeare Library came to George Mason University’s campus to run an encode-a-thon with the upper-level undergraduates who were students in my Early Modern England course.

For this event, we were working on the Elizabethan Court Day By Day dataset, compiled by Marion E. Colthorpe. While the origin of this project was an attempt to track Queen Elizabeth’s royal progresses through the countryside over the course of her reign, it morphed into a dataset tracking the events of her court for ever day of her 44-year reign. It includes not just a list of events but also select quotations from a wide variety of primary sources.

Folgerpedia page explaining the Elizabethan Court Day By Day datasetThis dataset was donated to the Folger Shakespeare Library as a massive PDF. At over 2000 pages long, it’s a treasure trove of information about the peregrinations and events of Elizabeth’s reign. The Digital Media and Publications team at the Folger have extracted the information from the dataset into plain text and have been working to encode it, to facilitate future analyses of the data.

This encoding is done in a modified version of the Folger’s Dromio TEI transcription/collation tool, developed by Mike Poston, for Early Modern Manuscripts Online transcribathons. Students begin by entering their name or the alias by which they would like to receive credit – I hear rumors William Shakespeare is quite active on the platform! Then they choose a month of Elizabeth’s reign to begin encoding and land in the interface pictured below.

image of HTML encoding of datasetThe first line of each day is metadata (colored red in the image to the right) where participants record the day, the type of event that has been captured, and the location of the event (where known). This particular month is February, 1601, chosen as the dates for the Earl of Essex’s rebellion – there are two events on the 7th and one on the 8th. While I wasn’t certain where Essex was when he refused to obey the Privy Council’s summons (politics), his followers were definitely at the Globe Theatre later that day, when the Lord Chamberlain’s Men performed Richard II (performance), presumably to get them in the right headspace for their attempted rebellion! The events of the 8th were somewhere in London, per the text, but at multiple locations within the city, hence the location is recorded at a larger scale than the single building of the Globe.

After adding (or editing some of the automatically generated) metadata about each day, students then marked up each day’s text by highlighting important words/phrases and clicking the buttons at the top of the interface to designate them as people (individual people, groups of people, or countries acting as people such as “Spain invaded”), places, dates, quotes, books, or general sources. While straightforward enough for a novice human encoder, this isn’t a task that can be done automatically for a lot reasons. For example, Essex is a person, a county, and also (in conjunction with the word “House”) a building in London.

image of XML encoding of datasetMost of my students worked solely in the interface, but a significant minority also flipped over into the XML markup view and dealt with manual tags, especially when they were dealing with days that needed to be split into multiple events or other complicated encodings. As someone who is personally familiar with XML, this view was in a lot of ways easier for me to work with as I could see very clearly when I’d accidentally gotten a tag in the wrong space or included a space in a place tag, or other “messiness” that I know will have to be processed out in the final analysis of the dataset.

While my students weren’t entirely certain, going into the event, how exactly this “encode-a-thon” thing was going to relate to their other classroom experiences, when I briefed my students after the event, they identified a number of positive outcomes they’d had from the activity:

  • up-close and personal look at daily life among Elizabethan elite and their servants
  • humanized historical actors
  • looking at “raw data” of facts/events that forms historical narratives
  • variety of sources used to reconstruct narrative of events
  • coverage of major events that didn’t make it into the classroom narrative due to in-class time limits
  • work behind building historical datasets
  • critically think about categorization of events/activities
  • introduction to XML (advanced students only)

And, perhaps most importantly, in between them regaling me with the stories they’d uncovered – and linking those stories back to important points I’d made in class lectures and their assignments – they reported having fun.

Current Research in Digital History 2019

This past Saturday was the second annual Current Research in Digital History conference, organized by Stephen Robertson and Lincoln Mullen (with help from the amazing Thanh Nguyen), and co-sponsored by Roy Rosenzweig Center for History and New Media, the Colored Conventions Project, and the African American Intellectual History Society.

For those of you who are unfamiliar with CRDH, it’s an annual, open-access and peer-reviewed publication with an associated conference – more information can be found on its website including past volumes of the publication, past conference programs, and (eventually) the new CFP for CRDH 2020. You should definitely come to CRDH 2020. And bring a friend!

As an inveterate conference tweeter, I spent a lot of time on Tweetdeck during the conference and was generally pleased by the amount of Twitter engagement we had given the small conference size. So in honor of the conference Twitterati (is that a word? It is now!) I’ve done a quick analysis and visualization of our activity.

Global Network Stats:

Nodes: 198 (people with separate Twitter @-handles)

Edges: 552 (tweets and retweets)

Average weighted node degree: 4.369 (@-handles were mentioned in an average of 4.369 tweets/retweets, including repeat mentions)

The network is disconnected (there are people who used the hashtag who never tweeted to each other or retweeted each other’s tweets) into two components and the largest connected component has diameter 5.

The Major Nodes:

When looking at the conference network, some nodes immediately jump out due to the node color/size scheme I’ve applied to the visualization: nodes with lower degree (less tweets originated with or included that @-handle) are blue while nodes with higher degree (more tweets originated with or included that @-handle) are yellow, orange, or red and progressively larger as we get towards the red/highest (unweighted) degree nodes.

If we look strictly at the numbers, the top nodes by (weighted) degree are jotis13 (yes, I’m writing about myself in the third person); jimccasey1; nolauren; JenServenti; CCP_org; profgabrielle; dgburgher; chnm; historying; seth_denbo; FreeBlack TX; and harmonybench. This is not, strictly speaking, surprising as these were heavy conference tweeters and/or presenters who included on their Twitter handles on slides for easy tweeting of their research.

However, if we look at betweenness centrality (which is another network analysis metric that measures, if you’re trying to get from one part of the network to another as efficiently as possible using the edges, which nodes do you go through?) we get both some familiar orange/red nodes as well as some of the yellow, middling-degree nodes: jotis13; JenServenti; jimccasey1; nolauren; seth_denbo; historying; CCP_org; profgabrielle; Zoe_LeBlanc; kramermj; and harmonybench.

The contrast between these two measures enables us to draw some conclusions about how different Twitter handles were functioning in the network. For example, both JenServenti and seth_denbo rank significantly higher in betweenness centrality than node degree; their importance as connectors in the network were higher than expected given their volume of tweets/mentions. Given their respective positions at the NEH and AHA, the fact that they’re also essential connectors in this Twitter network should perhaps not be surprising.

By contrast, CCP_org and profgabrielle rank higher in node degree than betweenness centrality. A quick sneak peek at a different network measure – closeness centrality, basically how central a node is to a network – shows that they are tied for the second highest closeness centrality in the network (after jotis13). So while CCP_org and profgabrielle may not be on as many of the shortest path through the networks (likely because those paths are routing through jotis13 instead) they are two of the three most central nodes in the network. In other words, their voices were vital to the conversations we were having (both in person and online).

Another particularly interesting thing to note about nodes with high betweenness centrality is that neither Zoe_LeBlanc nor kramermj were physically present at #crdh2019. While this is not an unfamiliar phenomenon – conference tweeting, by its very nature, enables the virtual inclusion of people at conferences – what is particularly fascinating is that both of them played a very similar role in the network. Specifically, they signal-boosted a conversation about the diversity of digital scholarship to a wide variety of people who were not present at #crdh2019 and didn’t necessarily participate in wider conference conversations.

The Viral(ish) Subtopic:

While there were several stand-out tweets that got more traction than others (including the first one pictured at the top of the image, citing Jessica Marie Johnson’s essay, Markup Bodies) one in particular got the most attention and spawned follow-up comment threads (both “on” and “off” hashtag). It was the record of the following brief conversation:

profgabrielle asked jimccasey1, “How many years did it take you to create your dataset?”

jimccasey1 replied, “Going on seven.”

The conversation then continued on (in real life and online) by discussing the fact that creating datasets are not often considered scholarship, despite the interpretation, analysis, and scholarly skill that goes into creating them.

A few scholars chimed in to note that their institutional Promotion and Tenure guidelines had been updated to explicitly include digital scholarship as scholarship, not service. But the conversation largely revolved around the difficulties digital historians face in producing work that doesn’t fit easily into the “monographs, articles, book chapters” model of scholarship that still dominates the majority of the field.

Others noticed that the issues digital historians face in getting their databases recognized a scholarship echoed issues public historians have already been struggling with, particularly getting recognized for the work they do in creating oral history collections. The related issue of crediting the incredible scholarly work of librarians and archivists – which forms the foundation for much historical scholarship – also came up (echoing a few earlier conversations wishing there were more librarians in the room with us!)

Thematically, these conversations tied in strongly with the historical conversations we were having about the need to recover and recognize the vital work of women – especially Black women – in our historical narratives. I want to particularly highlight the Colored Convention Project (CCP_org)’s Teaching Partner Memo of Understanding:

I will assign a connected Black woman such as a wife, daughter, sister, fellow church member, etc., along with every male convention delegate. This is our shared commitment to recovering a convention movement that includes women’s activism and presence—even though it’s largely written out of the minutes themselves.

Building a dataset is hard work, and it’s tempting to focus on the most easily recovered historical figures from the archives. The CCP commits to doing the extra research to figuring out, for example, that “a lady” is actually Sydna E.R. Francis. This is an act of scholarship and we need to figure out better ways to recognizing it as such.

Final Thoughts:

CRDH is a small conference, and a new one, but that enables us to see exactly how widespread its (Twitter) impact is beyond immediate participants in the conference. I haven’t done enough small conference analyses to draw any conclusions about whether or not CRDH is “punching above its weight,” but it’s clear that the conversations we had on Saturday – particularly the ones about recognition and credit, both historically and in terms of our own scholarship – struck a chord with people online and traveled far beyond those rooms in GMU’s Founders Hall. And for anyone who’s now wishing they’d been there in person, hopefully the #crdh2019 tweets will hold you over until the next issue of Current Research in Digital History is published this fall!

Notes on Method/Dataset:

This data was collected via Martin Hawksey’s TAGS. Because the hashtag was created during the conference and the Twitter conversation ended by Monday (yesterday), this is a complete dataset of all tweets with the conference hashtag to date. I’ll be tweeting this blog post with the hashtag, so it will not be a complete dataset of all tweets with the hashtag because that would get circular fast…

For full information on my network creation methods, see this blog post.

Never Use White Text on a Black Background: Astygmatism and Conference Slides

TL;DR – never use white text on a black background in your slides.

This post has been a long time coming. Every conference I go to, there will be at least one (and more often ten or twenty) presentations that use white text on a black background. These slides range from hard-to-read to outright illegible and in particularly bad set-ups are so visually painful that I have to close my eyes or turn away from the projection screen. Even conferences that provide advice on designing accessible presentations nod at the “make slides high contrast” but are silent on the white text issue. So! Here it is.

The facts:

  • approximately half the population has some degree of astigmatism
  • white text on black backgrounds creates a visual fuzzing effect called “halation”
  • halation is known to reduce readability of text and is particularly bad for people with astygmatism

The visual aids:

you.jpgme.jpg

full-text2.png

So please, everyone, strike white text with black backgrounds from your color repetoire, the same way you’ve removed color combinations that are illegible to color-blind people. It’s not a question of preferences, it’s an accessibility issue.

Conference Strategies for the Shy and Introverted

So, a comment on Twitter last night made me realize how many strategies I’ve developed over the past few years to deal with being shy and introverted in a conference environment. To anyone who has met me and is laughing at the thought of me being either shy or introverted? I rest my case as to the effectiveness of some of my strategies! Caveats that these are still very much a work in progress, they function best at small-to-midsize conferences, and I don’t always practice what I preach 🙂

So, without further ado, some strategies that will hopefully be of help to other folks as well:

1) Remember that self-care is more important than “networking.” If you start to hit the end of your abilities to cope with people and bounce off a reception/event/invitation, don’t beat yourself up over it. It takes me much less time to recover from oversocialization if realize I’m at my limit and manage to step back before crashing.

2) Find a conference buddy who is willing to be your social “home base” for some of the breaks, meals, and group events. Ideally said conference buddy will be less shy/introverted than you are, and/or know a few people you don’t and can introduce you to them, but that’s not necessary. You just need someone you can hang out with so you don’t feel socially isolated.

2a) If you have a really good friend, you can also room with your conference buddy to save money and improve the ease of schedule coordination.

3) If possible, make plans to eat with folks in advance. I find that figuring out group meals is one of the most difficult parts of conference networking because it’s far harder to casually fall into a meal group than to have a quick chat during a coffee break.

4) If you’re alone during breaks/receptions, you can hover for a bit (a minute or so is usually my max) near groups of people that are having interesting conversations and/or include someone you sort of know. Sometimes the circle will organically open to include you.

4a) If you’re in one of those groups and see someone hovering alone, physically move a bit to open the circle and give them space to join you. Introverts helping out other introverts for the win!

5) If starting up an in-person conversation with strangers is too hard, try chatting to folks on Twitter during panels then going up to meet them afterwards. “Hi, we were just talking on Twitter earlier and I wanted to introduce myself in person” makes meeting new people a lot less stressful, especially if you can then continue a conversation you started online.

6) Acquaintance chaining works. You know one person who introduces you to a person who then introduces you to another person and suddenly you hit the point where you start to know a lot of people.

7) Reassure yourself that communities build over time. The first several conferences can be hard, but eventually you’ll hit a tipping point where you’ve met enough people in the community that things get easier. They never get EASY but if conferences were easy, then we wouldn’t be introverted, now would we?

Twitter at the Big Three: Global Network Stats

Every year in the break between Fall and Spring academic semesters, tens of thousands of scholars from across the world descend on an American city for several caffeine-fueled days of panels, receptions, job interviews, and social networking. Actually, this happens more than once, as members of the American Historical Association, the Modern Language Association, and the American Library Association all meet in January. And while most of their social networking happens face-to-face, some of it happens on Twitter where enterprising digital humanists armed with Martin Hawksey’s TAGS can collect conference tweets and analyze them for fun and profit.

Posts in this (intended) series include (and will be linked as they are published):

  1. Global Networks Stats
  2. Bipartite Network Analysis
  3. Directed Network Analysis
  4. Preliminary Conclusions (TL;DR)
  5. The Methods Post

So without further ado, here are some initial stats about the networks I constructed from the three official conference Twitter hashtags: #aha17, #mla17, and #alamw17.

The AHA network is the smallest at 2,826 nodes (people who either tweeted or whose twitter handle showed up in another person’s tweets) and 6,945 edges (connections generated by said tweets). These edges have been weighted so that if Person A mentions Person B 14 times in tweets, the edge from Person A to Person B has weight 14. If Person A mentions Person C only once, the edge from Person A to Person C has weight 1. The average degree is 2.5 (number of edges divided by number of nodes) but when weight is factored in (edges are multiplied by their weight before added and divided by number of nodes) the average weighted degree is 3.9.

There are 74 connected components (subnetworks with no connection to the rest of the network), with the largest connected component containing 90% of the nodes and 96% of the edges in the overall network. This component has diameter 10 (the shortest distance between two people furthest away from each other) and average path length 4.3 (average of the shortest distance between every pair of people in the network).

The MLA network is slightly bigger and slightly more connected:

  • nodes: 3,538
  • edges: 10,178
  • average degree: 2.9
  • average weighted degree: 5.2
  • connected components: 70
  • largest connected component contains
    • nodes: 94.2%
    • edges: 97.8%
  • diameter 12
  • average path length 4.4

The ALA network is the largest and most connected:

  • nodes: 7,851
  • edges: 20,505
  • average degree: 2.6
  • average weighted degree: 3.9
  • connected components: 99
  • largest connected component:
    • nodes: 96.1%
    • edges: 98.9%
  • diameter: 14
  • average path length: 5.4

So what happens when we put it all together?

bigthree
Green edges = #aha17 hashtag. Red edges = #mla17 hashtag. Blue edges = #alamw17 hashtag.

Merging the three networks together creates some overlap of nodes (people on Twitter during more than one conference) and edges (people tweeting to the same people at more than one conference) but the three networks remain largely discrete. The force atlas 2 layout I employed in Gephi created more overlap of the AHA and MLA conferences than the ALA conference, but in general disciplinarity is the rule of the day.

While some of this is likely an artifact of most scholars’ inability to physically attend multiple conferences (the AHA and MLA, in particular, occurred at the same time in Colorado and Pennsylvania respectively), scholars have the ability to interact via Twitter with conferences they aren’t attending. The co-occurrance of the AHA and MLA could have – theoretically – increased connectivity between the two conferences if similar themes and conversations arose at both then connected via social media. Alas, I don’t have the 2015 metrics (the last time these conferences didn’t co-occur) to do a comparison, but if anyone has them and wants to share I’d love to see them!

In general, the merged “Big Three” network stats clearly derive from their constituent conferences’ stats:

  • nodes: 13,489
  • edges: 37,308
  • average degree: 2.8
  • average weighted degree: 4.5
  • connected components: 203
  • largest connected component:
    • nodes: 95%
    • edges: 98.3%
  • diameter: 16
  • average path length: 5.9

One of these numbers, however, immediately jumped out at me as not like the others: the number of connected components. If only the largest connected component of each conference network had been able to connected in the Big Three network, there should have been 74+(70-1)+(99-1)=241 connected components. Instead, 38 of the small components in the conference networks appear to have merged with another component (either the largest connected component or another small component).

This is encouraging to me as it implies that there is an interdisciplinary scholarly community that emerges on Twitter, not just in the dense “center” of the network but also in the disconnected “margins.” In is not (yet?) clear whether this interdisciplinary community is generated by digital humanists, librarians, geographical proximity, common interests, or – most likely – some combination of factors, including some I haven’t considered.

Regardless of the cause, something is going on. In the interests of exploring it, next time I’m going to restructure my data as a bipartite network to see if anything else interesting emerges.


Conferences and Invisible Disabilities

For two decades, if you suggested that I was disabled, I would have given you a strange look and a skeptical, “okaaaay?”

Sure, I have asthma and have to take meds twice a day (okay, six times a day during flare-ups) but that is as normal to me as brushing my teeth twice a day. And yes, I am intimately familiar with the emergency departments of six different hospitals, but that’s because I’ve moved a lot. And sure, there are a lot of things I haven’t been able to do because of my asthma, but I’m not the kind of person who wants to hang out in a bar or go clubbing on a regular basis or attend academic conferences-

Yeah, I hope I just made you do a double-take.

What do the History of Science Society; the North American Conference on British Studies; and the Society for the History of Authorship, Reading, and Publishing have in common? Besides being awesome professional societies (or I wouldn’t belong to them!), they have all held conferences that I attended where I suffered severe respiratory distress because of the asthma-unfriendly cities they chose for their conferences.

I’m not going to sugarcoat it. When my co-collaborators and I decided we wanted to present our work at SHARP and then I realized the conference was in Paris, I nearly burst into tears because dear God, I didn’t want to have to suffer through an asthma attack on purpose. It took me four weeks to recover from that conference in Paris last summer. I almost didn’t apply to present at the Alliance of Digital Humanities Organizations conference next summer because it’s going to be in Montreal, which isn’t quite as bad as Paris, by which I mean it’ll probably “only” take me a week or so before I can breathe normally again.

So this is a plea for conference organizers to add more items to a checklist that, I appreciate, is already pretty long! But if you want your conferences to be truly accessible, you need to take into account the invisible, as well as visible, disabilities.

  1. Do you know what the air quality is like in the city you’ve chosen for your conference? Hint: if it’s a city where cigarette, cigar, and/or marijuana smoking is socially acceptable, it’s not going to be good. Also, think about vehicle and manufacturing exhaust, and the likelihood of wildfires. No, you can’t work miracles – cities are cities – but you should be aware of the situation, know when you’re choosing a venue that will potentially hurt people attending your conference, and keep your attendees informed about potential air quality issues.
  2. Is the hotel you’ve chosen strictly non-smoking? Because, let’s face it, any hotel with smoking rooms is going to cross-contaminate the non-smoking rooms, even if it’s just via the laundry.
  3. Is your meeting venue attached to your hotel? Or will attendees have to go outside, running the “smoker’s gauntlet” that inevitably springs up right outside hotel doors? Because not everyone can hold their breath and run – and frankly, we shouldn’t have to.
  4. Does your hotel AND meeting venue have year-round climate control? Yes, that means air conditioning in the summer, even in northern climates. Because asthmatics can’t just “open a window” and the lack of climate control leads to issues with humidity and mold growth, air circulation, and other asthma-attack-inciting conditions.

That’s it. Four things to keep your conference attendees from having to choose between their careers and their health. Because we all like to breathe.

I Tweet Therefore I Am Paying Attention

While I’m not on Twitter daily, I am a very active conference tweeter. I’m one of those people sitting by the electrical outlet with my laptop, hastily typing as the speakers present. To give you a better sense of the dichotomy between my everyday and conference tweeting, I present a screenshot of my July Twitter analytics:

tweet_activity

Can you guess when SHARP 2016 occurred?

I’ve had a few people ask me about conference tweeting. What am I doing? Why? And – most importantly – how can I listen and tweet at the same time?

Conference Tweeting 101

The idea is straightforward. As you listen to a speaker, you extract the main ideas, themes, questions, and illuminating examples. You then tweet these things, ideally each one in a single tweet but breaking it across multiple tweets is also an option if the idea is especially complex.

Because all good academics cite their sources, the format of these tweets tends to be something like “Name: idea expounded here #conferencehashtag” or “idea expounded here @speakersTwitterHandle #conferencehashtag”  Session hashtags sometimes emerge at more Twitter active conferences, to separate out the conversations happening around each panel.

tweet

Whenever possible, it’s best to include the speaker’s Twitter handle because this means they will be automatically notified of your tweet (and be able to see other Twitter users’ interest in their ideas). They will also be included in any conversations that happen because someone responds to your tweet. HOWEVER for that to happen, the speaker needs to tell the audience what their Twitter handle is.

Pro Tip: if you have a/v and want your talk to be tweeted, it’s best to include your Twiter handle at the bottom of every one of your conference slides.

The Benefits of Conference Tweeting

… are legion. Because I want to keep this short, I’ll stick to my top two.

You can’t be in more than one panel at a time, assuming you can even afford to attend the conference in the first place. Conference tweeting allows you to “peek” into other panels, spot synchronicity of themes across multiple panels, and virtually attend far more scholarly events than even the most generous professional development stipend could allow.

Social network visualization

Furthermore, conference tweeting is a fantastic way to network – to find people with like interests and spark conversations that begin online, continue in receptions, and last after that conference ends. I’ve had collaborations and future conference panels emerge organically from these conversations, in a way they never would have if I’d sat alone in the back of a conference room then quickly escaped that reception full of strangers

The Concentration Question

This is the question I get asked most often and I’ll give a longer version of my usual response. We train all our academic careers to take notes while listening to lectures and other auditory events. In fact, this is a skill I’ve practiced so long, I have to take notes in order to actively listen to a talk. If I’m not taking notes, I tune out. And for me, conference tweeting is a form of note-taking.

When the Internet connection’s bad, I still take notes in a text document, but I vastly prefer note-taking via Twitter. First, I almost never go back to look at my old notes but I do continuously reenage with old tweets either because someone’s liked/retweeted something or because I’m analyzing datasets of old conference tweets.

Image of conference tweets archive
Tweets Captured with TAGS v6.0 ns

Second, Twitter functions as essentially a communal note-taking platform, enabling me to see what other people are getting out of the same talk. Third, the public nature of this note-taking leads to immediate conversations with other conference tweeting, in which we dissect, analyze, and expand on the ideas we’re hearing together.

So the next time you’re sitting in a conference next to me or anyone else who has Twitter open in the browser, you’ll know: I tweet therefore I am paying attention.