Current Research in Digital History 2019

This past Saturday was the second annual Current Research in Digital History conference, organized by Stephen Robertson and Lincoln Mullen (with help from the amazing Thanh Nguyen), and co-sponsored by Roy Rosenzweig Center for History and New Media, the Colored Conventions Project, and the African American Intellectual History Society.

For those of you who are unfamiliar with CRDH, it’s an annual, open-access and peer-reviewed publication with an associated conference – more information can be found on its website including past volumes of the publication, past conference programs, and (eventually) the new CFP for CRDH 2020. You should definitely come to CRDH 2020. And bring a friend!

As an inveterate conference tweeter, I spent a lot of time on Tweetdeck during the conference and was generally pleased by the amount of Twitter engagement we had given the small conference size. So in honor of the conference Twitterati (is that a word? It is now!) I’ve done a quick analysis and visualization of our activity.

Global Network Stats:

Nodes: 198 (people with separate Twitter @-handles)

Edges: 552 (tweets and retweets)

Average weighted node degree: 4.369 (@-handles were mentioned in an average of 4.369 tweets/retweets, including repeat mentions)

The network is disconnected (there are people who used the hashtag who never tweeted to each other or retweeted each other’s tweets) into two components and the largest connected component has diameter 5.

The Major Nodes:

When looking at the conference network, some nodes immediately jump out due to the node color/size scheme I’ve applied to the visualization: nodes with lower degree (less tweets originated with or included that @-handle) are blue while nodes with higher degree (more tweets originated with or included that @-handle) are yellow, orange, or red and progressively larger as we get towards the red/highest (unweighted) degree nodes.

If we look strictly at the numbers, the top nodes by (weighted) degree are jotis13 (yes, I’m writing about myself in the third person); jimccasey1; nolauren; JenServenti; CCP_org; profgabrielle; dgburgher; chnm; historying; seth_denbo; FreeBlack TX; and harmonybench. This is not, strictly speaking, surprising as these were heavy conference tweeters and/or presenters who included on their Twitter handles on slides for easy tweeting of their research.

However, if we look at betweenness centrality (which is another network analysis metric that measures, if you’re trying to get from one part of the network to another as efficiently as possible using the edges, which nodes do you go through?) we get both some familiar orange/red nodes as well as some of the yellow, middling-degree nodes: jotis13; JenServenti; jimccasey1; nolauren; seth_denbo; historying; CCP_org; profgabrielle; Zoe_LeBlanc; kramermj; and harmonybench.

The contrast between these two measures enables us to draw some conclusions about how different Twitter handles were functioning in the network. For example, both JenServenti and seth_denbo rank significantly higher in betweenness centrality than node degree; their importance as connectors in the network were higher than expected given their volume of tweets/mentions. Given their respective positions at the NEH and AHA, the fact that they’re also essential connectors in this Twitter network should perhaps not be surprising.

By contrast, CCP_org and profgabrielle rank higher in node degree than betweenness centrality. A quick sneak peek at a different network measure – closeness centrality, basically how central a node is to a network – shows that they are tied for the second highest closeness centrality in the network (after jotis13). So while CCP_org and profgabrielle may not be on as many of the shortest path through the networks (likely because those paths are routing through jotis13 instead) they are two of the three most central nodes in the network. In other words, their voices were vital to the conversations we were having (both in person and online).

Another particularly interesting thing to note about nodes with high betweenness centrality is that neither Zoe_LeBlanc nor kramermj were physically present at #crdh2019. While this is not an unfamiliar phenomenon – conference tweeting, by its very nature, enables the virtual inclusion of people at conferences – what is particularly fascinating is that both of them played a very similar role in the network. Specifically, they signal-boosted a conversation about the diversity of digital scholarship to a wide variety of people who were not present at #crdh2019 and didn’t necessarily participate in wider conference conversations.

The Viral(ish) Subtopic:

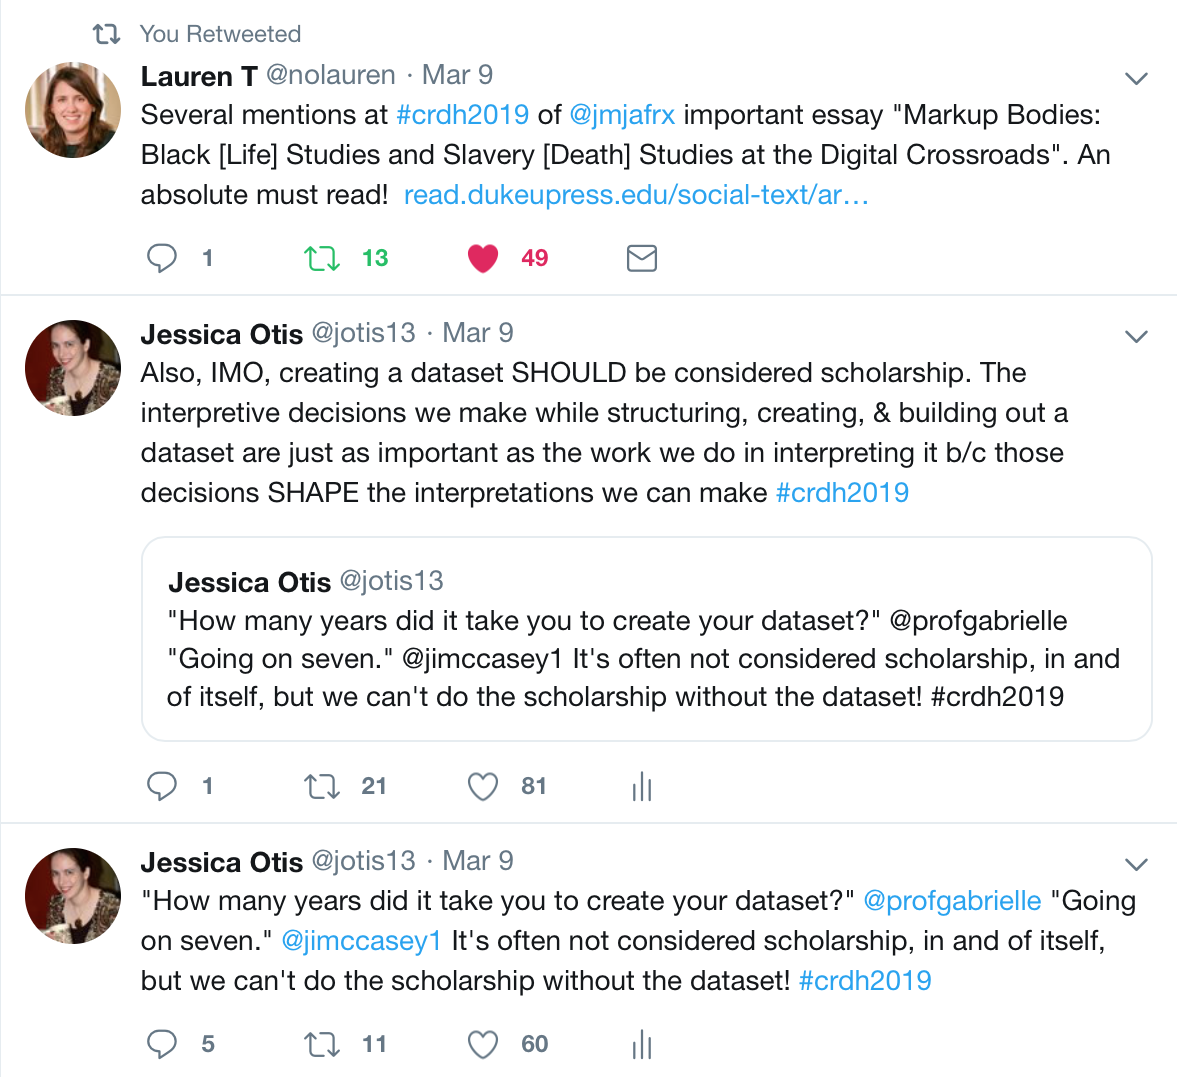
While there were several stand-out tweets that got more traction than others (including the first one pictured at the top of the image, citing Jessica Marie Johnson’s essay, Markup Bodies) one in particular got the most attention and spawned follow-up comment threads (both “on” and “off” hashtag). It was the record of the following brief conversation:

profgabrielle asked jimccasey1, “How many years did it take you to create your dataset?”

jimccasey1 replied, “Going on seven.”

The conversation then continued on (in real life and online) by discussing the fact that creating datasets are not often considered scholarship, despite the interpretation, analysis, and scholarly skill that goes into creating them.

A few scholars chimed in to note that their institutional Promotion and Tenure guidelines had been updated to explicitly include digital scholarship as scholarship, not service. But the conversation largely revolved around the difficulties digital historians face in producing work that doesn’t fit easily into the “monographs, articles, book chapters” model of scholarship that still dominates the majority of the field.

Others noticed that the issues digital historians face in getting their databases recognized a scholarship echoed issues public historians have already been struggling with, particularly getting recognized for the work they do in creating oral history collections. The related issue of crediting the incredible scholarly work of librarians and archivists – which forms the foundation for much historical scholarship – also came up (echoing a few earlier conversations wishing there were more librarians in the room with us!)

Thematically, these conversations tied in strongly with the historical conversations we were having about the need to recover and recognize the vital work of women – especially Black women – in our historical narratives. I want to particularly highlight the Colored Convention Project (CCP_org)’s Teaching Partner Memo of Understanding:

I will assign a connected Black woman such as a wife, daughter, sister, fellow church member, etc., along with every male convention delegate. This is our shared commitment to recovering a convention movement that includes women’s activism and presence—even though it’s largely written out of the minutes themselves.

Building a dataset is hard work, and it’s tempting to focus on the most easily recovered historical figures from the archives. The CCP commits to doing the extra research to figuring out, for example, that “a lady” is actually Sydna E.R. Francis. This is an act of scholarship and we need to figure out better ways to recognizing it as such.

Final Thoughts:

CRDH is a small conference, and a new one, but that enables us to see exactly how widespread its (Twitter) impact is beyond immediate participants in the conference. I haven’t done enough small conference analyses to draw any conclusions about whether or not CRDH is “punching above its weight,” but it’s clear that the conversations we had on Saturday – particularly the ones about recognition and credit, both historically and in terms of our own scholarship – struck a chord with people online and traveled far beyond those rooms in GMU’s Founders Hall. And for anyone who’s now wishing they’d been there in person, hopefully the #crdh2019 tweets will hold you over until the next issue of Current Research in Digital History is published this fall!

Notes on Method/Dataset:

This data was collected via Martin Hawksey’s TAGS. Because the hashtag was created during the conference and the Twitter conversation ended by Monday (yesterday), this is a complete dataset of all tweets with the conference hashtag to date. I’ll be tweeting this blog post with the hashtag, so it will not be a complete dataset of all tweets with the hashtag because that would get circular fast…

For full information on my network creation methods, see this blog post.

Never Use White Text on a Black Background: Astygmatism and Conference Slides

TL;DR – never use white text on a black background in your slides.

This post has been a long time coming. Every conference I go to, there will be at least one (and more often ten or twenty) presentations that use white text on a black background. These slides range from hard-to-read to outright illegible and in particularly bad set-ups are so visually painful that I have to close my eyes or turn away from the projection screen. Even conferences that provide advice on designing accessible presentations nod at the “make slides high contrast” but are silent on the white text issue. So! Here it is.

The facts:

  • approximately half the population has some degree of astigmatism
  • white text on black backgrounds creates a visual fuzzing effect called “halation”
  • halation is known to reduce readability of text and is particularly bad for people with astygmatism

The visual aids:

you.jpgme.jpg

full-text2.png

So please, everyone, strike white text with black backgrounds from your color repetoire, the same way you’ve removed color combinations that are illegible to color-blind people. It’s not a question of preferences, it’s an accessibility issue.

Twitter at the Big Three: Global Network Stats

Every year in the break between Fall and Spring academic semesters, tens of thousands of scholars from across the world descend on an American city for several caffeine-fueled days of panels, receptions, job interviews, and social networking. Actually, this happens more than once, as members of the American Historical Association, the Modern Language Association, and the American Library Association all meet in January. And while most of their social networking happens face-to-face, some of it happens on Twitter where enterprising digital humanists armed with Martin Hawksey’s TAGS can collect conference tweets and analyze them for fun and profit.

Posts in this (intended) series include (and will be linked as they are published):

  1. Global Networks Stats
  2. Bipartite Network Analysis
  3. Directed Network Analysis
  4. Preliminary Conclusions (TL;DR)
  5. The Methods Post

So without further ado, here are some initial stats about the networks I constructed from the three official conference Twitter hashtags: #aha17, #mla17, and #alamw17.

The AHA network is the smallest at 2,826 nodes (people who either tweeted or whose twitter handle showed up in another person’s tweets) and 6,945 edges (connections generated by said tweets). These edges have been weighted so that if Person A mentions Person B 14 times in tweets, the edge from Person A to Person B has weight 14. If Person A mentions Person C only once, the edge from Person A to Person C has weight 1. The average degree is 2.5 (number of edges divided by number of nodes) but when weight is factored in (edges are multiplied by their weight before added and divided by number of nodes) the average weighted degree is 3.9.

There are 74 connected components (subnetworks with no connection to the rest of the network), with the largest connected component containing 90% of the nodes and 96% of the edges in the overall network. This component has diameter 10 (the shortest distance between two people furthest away from each other) and average path length 4.3 (average of the shortest distance between every pair of people in the network).

The MLA network is slightly bigger and slightly more connected:

  • nodes: 3,538
  • edges: 10,178
  • average degree: 2.9
  • average weighted degree: 5.2
  • connected components: 70
  • largest connected component contains
    • nodes: 94.2%
    • edges: 97.8%
  • diameter 12
  • average path length 4.4

The ALA network is the largest and most connected:

  • nodes: 7,851
  • edges: 20,505
  • average degree: 2.6
  • average weighted degree: 3.9
  • connected components: 99
  • largest connected component:
    • nodes: 96.1%
    • edges: 98.9%
  • diameter: 14
  • average path length: 5.4

So what happens when we put it all together?

bigthree
Green edges = #aha17 hashtag. Red edges = #mla17 hashtag. Blue edges = #alamw17 hashtag.

Merging the three networks together creates some overlap of nodes (people on Twitter during more than one conference) and edges (people tweeting to the same people at more than one conference) but the three networks remain largely discrete. The force atlas 2 layout I employed in Gephi created more overlap of the AHA and MLA conferences than the ALA conference, but in general disciplinarity is the rule of the day.

While some of this is likely an artifact of most scholars’ inability to physically attend multiple conferences (the AHA and MLA, in particular, occurred at the same time in Colorado and Pennsylvania respectively), scholars have the ability to interact via Twitter with conferences they aren’t attending. The co-occurrance of the AHA and MLA could have – theoretically – increased connectivity between the two conferences if similar themes and conversations arose at both then connected via social media. Alas, I don’t have the 2015 metrics (the last time these conferences didn’t co-occur) to do a comparison, but if anyone has them and wants to share I’d love to see them!

In general, the merged “Big Three” network stats clearly derive from their constituent conferences’ stats:

  • nodes: 13,489
  • edges: 37,308
  • average degree: 2.8
  • average weighted degree: 4.5
  • connected components: 203
  • largest connected component:
    • nodes: 95%
    • edges: 98.3%
  • diameter: 16
  • average path length: 5.9

One of these numbers, however, immediately jumped out at me as not like the others: the number of connected components. If only the largest connected component of each conference network had been able to connected in the Big Three network, there should have been 74+(70-1)+(99-1)=241 connected components. Instead, 38 of the small components in the conference networks appear to have merged with another component (either the largest connected component or another small component).

This is encouraging to me as it implies that there is an interdisciplinary scholarly community that emerges on Twitter, not just in the dense “center” of the network but also in the disconnected “margins.” In is not (yet?) clear whether this interdisciplinary community is generated by digital humanists, librarians, geographical proximity, common interests, or – most likely – some combination of factors, including some I haven’t considered.

Regardless of the cause, something is going on. In the interests of exploring it, next time I’m going to restructure my data as a bipartite network to see if anything else interesting emerges.


I Tweet Therefore I Am Paying Attention

While I’m not on Twitter daily, I am a very active conference tweeter. I’m one of those people sitting by the electrical outlet with my laptop, hastily typing as the speakers present. To give you a better sense of the dichotomy between my everyday and conference tweeting, I present a screenshot of my July Twitter analytics:

tweet_activity

Can you guess when SHARP 2016 occurred?

I’ve had a few people ask me about conference tweeting. What am I doing? Why? And – most importantly – how can I listen and tweet at the same time?

Conference Tweeting 101

The idea is straightforward. As you listen to a speaker, you extract the main ideas, themes, questions, and illuminating examples. You then tweet these things, ideally each one in a single tweet but breaking it across multiple tweets is also an option if the idea is especially complex.

Because all good academics cite their sources, the format of these tweets tends to be something like “Name: idea expounded here #conferencehashtag” or “idea expounded here @speakersTwitterHandle #conferencehashtag”  Session hashtags sometimes emerge at more Twitter active conferences, to separate out the conversations happening around each panel.

tweet

Whenever possible, it’s best to include the speaker’s Twitter handle because this means they will be automatically notified of your tweet (and be able to see other Twitter users’ interest in their ideas). They will also be included in any conversations that happen because someone responds to your tweet. HOWEVER for that to happen, the speaker needs to tell the audience what their Twitter handle is.

Pro Tip: if you have a/v and want your talk to be tweeted, it’s best to include your Twiter handle at the bottom of every one of your conference slides.

The Benefits of Conference Tweeting

… are legion. Because I want to keep this short, I’ll stick to my top two.

You can’t be in more than one panel at a time, assuming you can even afford to attend the conference in the first place. Conference tweeting allows you to “peek” into other panels, spot synchronicity of themes across multiple panels, and virtually attend far more scholarly events than even the most generous professional development stipend could allow.

Social network visualization

Furthermore, conference tweeting is a fantastic way to network – to find people with like interests and spark conversations that begin online, continue in receptions, and last after that conference ends. I’ve had collaborations and future conference panels emerge organically from these conversations, in a way they never would have if I’d sat alone in the back of a conference room then quickly escaped that reception full of strangers

The Concentration Question

This is the question I get asked most often and I’ll give a longer version of my usual response. We train all our academic careers to take notes while listening to lectures and other auditory events. In fact, this is a skill I’ve practiced so long, I have to take notes in order to actively listen to a talk. If I’m not taking notes, I tune out. And for me, conference tweeting is a form of note-taking.

When the Internet connection’s bad, I still take notes in a text document, but I vastly prefer note-taking via Twitter. First, I almost never go back to look at my old notes but I do continuously reenage with old tweets either because someone’s liked/retweeted something or because I’m analyzing datasets of old conference tweets.

Image of conference tweets archive
Tweets Captured with TAGS v6.0 ns

Second, Twitter functions as essentially a communal note-taking platform, enabling me to see what other people are getting out of the same talk. Third, the public nature of this note-taking leads to immediate conversations with other conference tweeting, in which we dissect, analyze, and expand on the ideas we’re hearing together.

So the next time you’re sitting in a conference next to me or anyone else who has Twitter open in the browser, you’ll know: I tweet therefore I am paying attention.

Hello, World!

# begin program

def DeliverGreetingsUntoTheInternet():

print “Hello, world! “

print “¡Hola, mundo! “

print “Bonjour, le monde!”

print “Salve, munde!”

# end program

As is traditional, the first post on this blog had to be “Hello world!”

To anyone who stumbles upon this page at some point, consider yourself greeted. As your reward for clicking into a “Hello, World!” post that could have been filled with lorem ipsum, here is a word cloude generated from my ancient accountability blog that I maintained during part of my graduate school dissertation research sojourn.

Untitled
2009 Word Cloud