This tutorial will introduce you to the basics of using OpenRefine to clean messy data. It was last updated in the Fall of 2020 for my HIST 696 Clio Wired graduate class.
Installation
Download Open Refine from https://openrefine.org/download.html and follow the installation instructions for your particular operating system – currently Open Refine is on version 3.3 and runs on Windows, Mac and Linux. Installing this should be similar to installing any other program on your computer. (NOTE: Mac users may have to go to their systems preferences and security & privacy settings to open the file after download if their security settings won’t allow them to open applications from “unknown” AKA open-source developers.)
Getting started
When you start Open Refine for the first time, something strange will happen. Instead of opening a stand-alone program, Open Refine will start your default web browser and navigate to the URL “http://127.0.0.1:3333.” Don’t worry, it’s all local to your computer – no one else can see your stuff and if you try to go to that URL without starting Open Refine, you won’t see anything there. If you close your browser but Open Refine is still running in the background, you can get back to this page at any point by typing that URL into your browser.
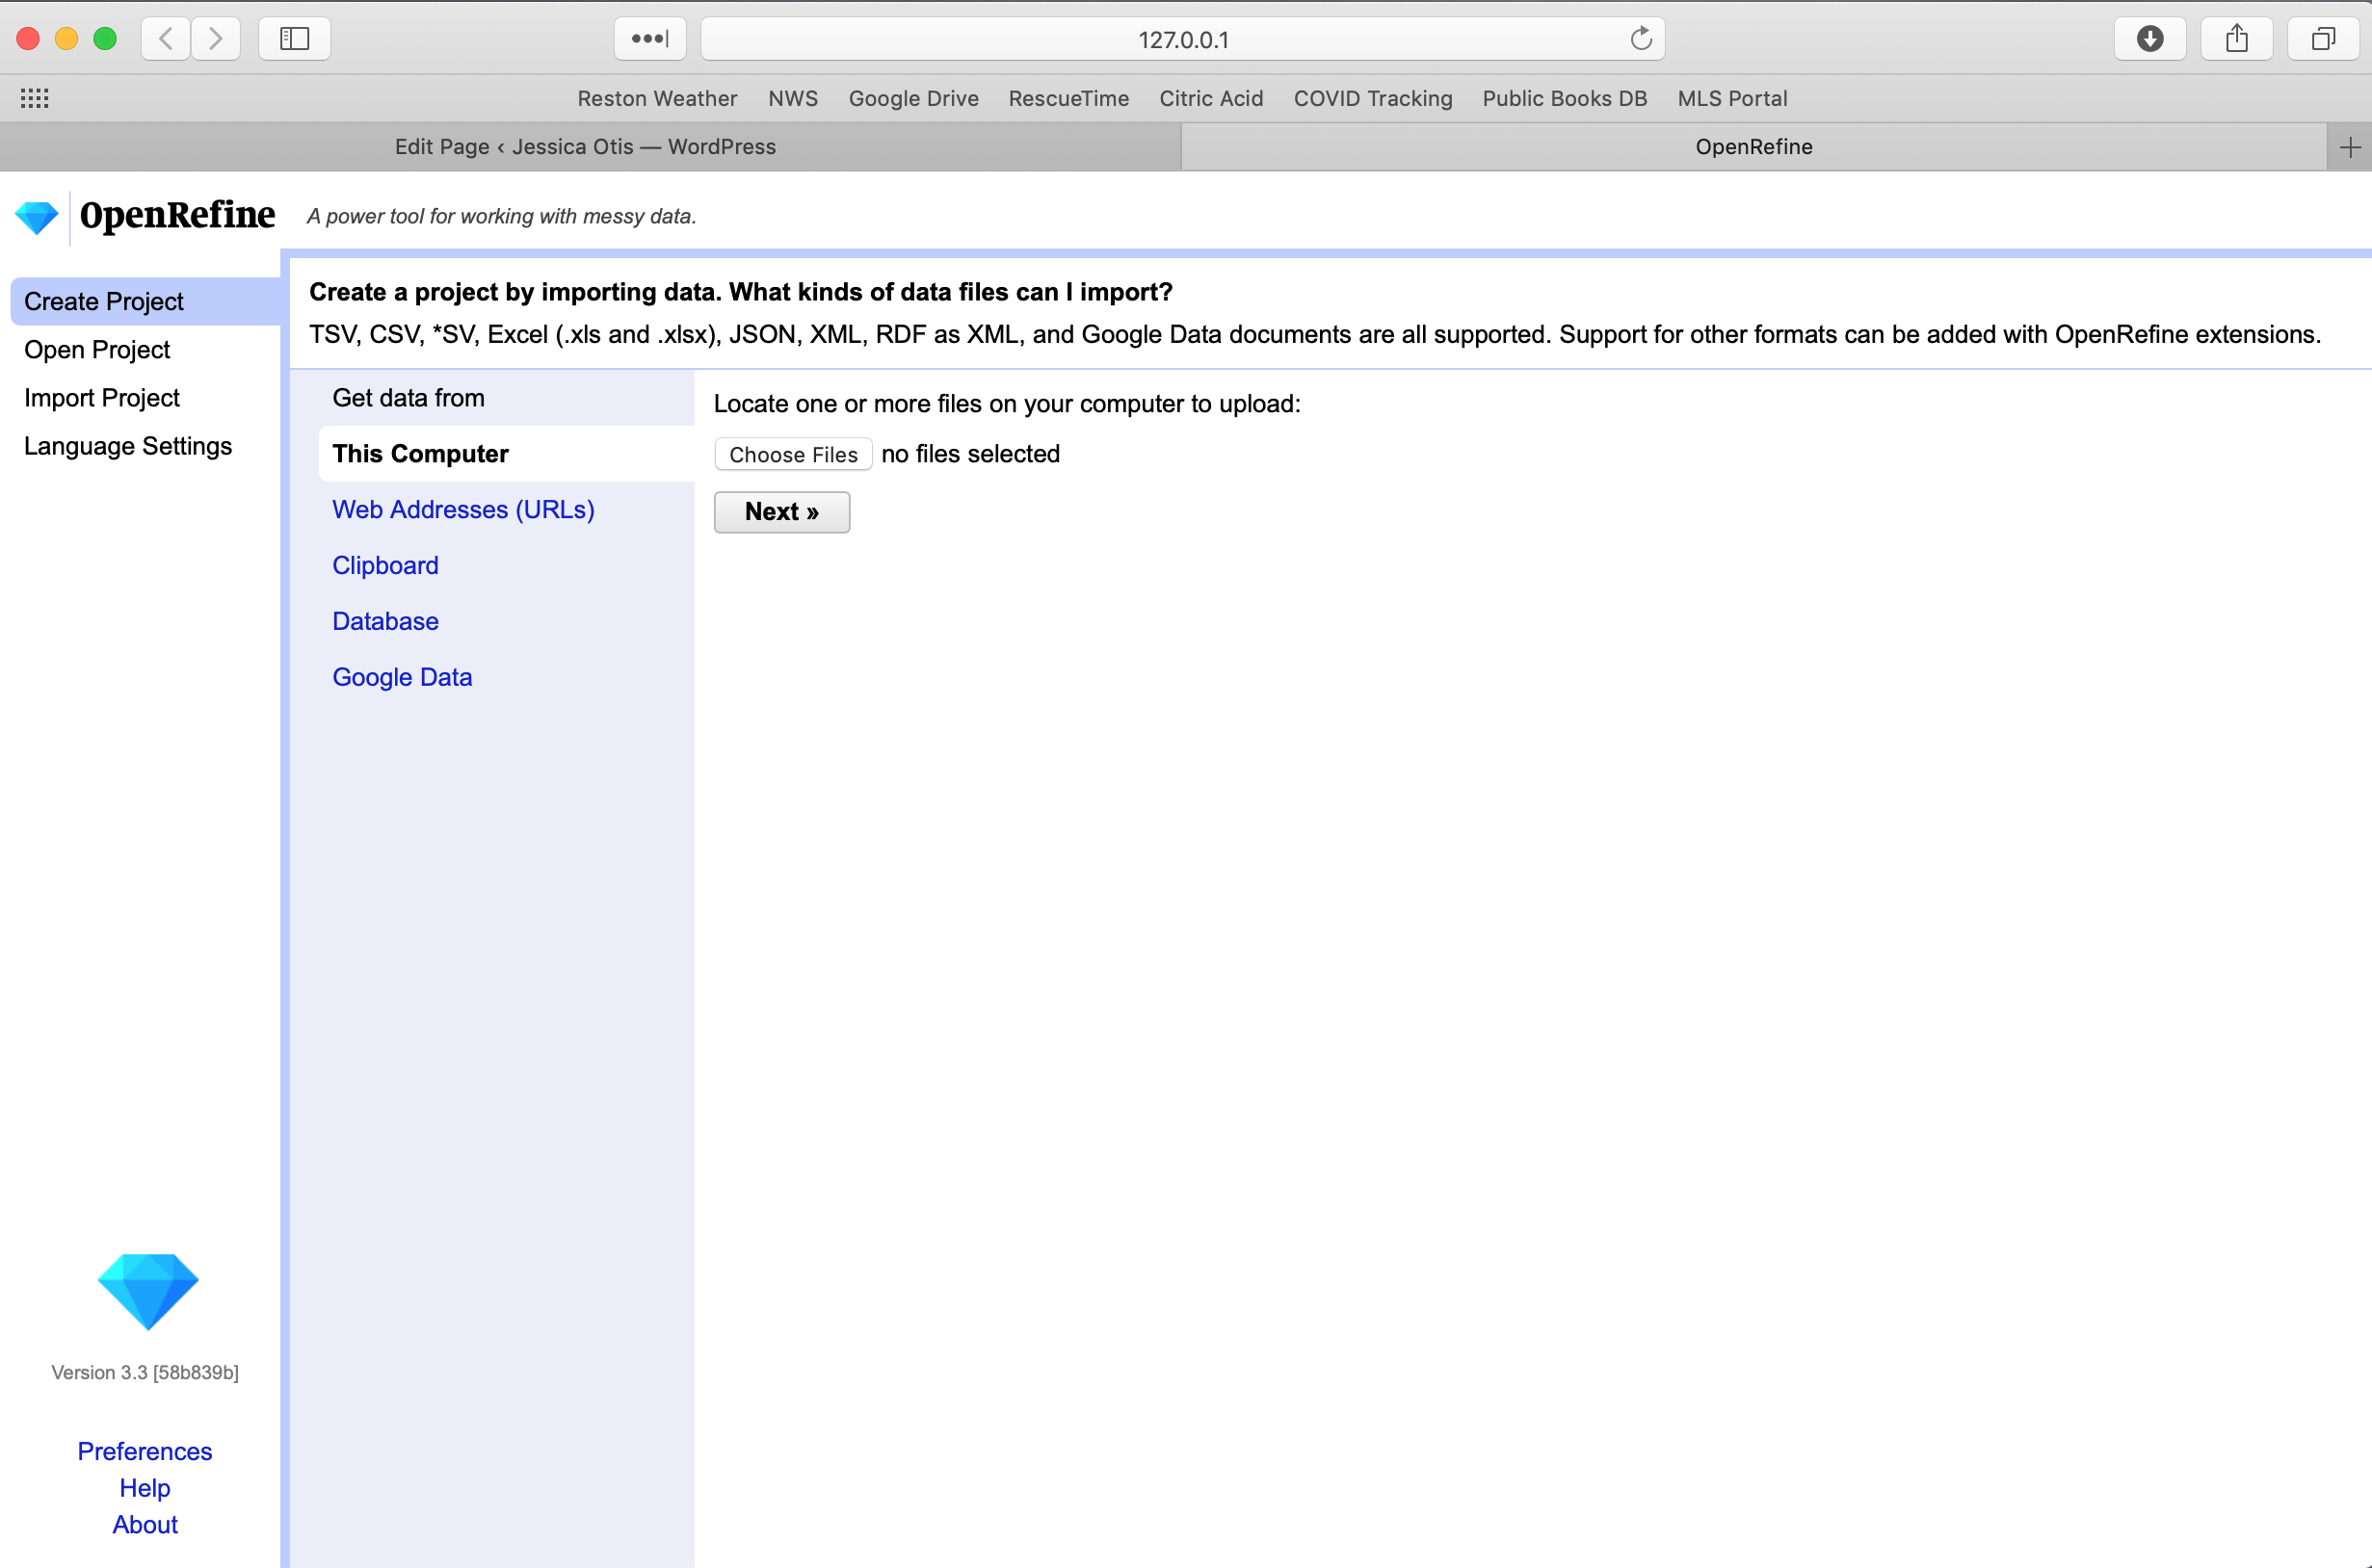
From here you can create a new project by importing data, open a pre-existing project you’ve already created, or import a project shared by someone else. You can see that we can import a wider variety of files including Excel files and CSVs.
Create a Sample Project
Download the module 2 sample data file from Basecamp and save it to your computer desktop. Then use the “Choose Files” button, select the sample data file, and use it to start a new project. Open Refine will show you a data preview and you should confirm that the header row has been identified and it’s correctly identified all the columns/rows. You can change the project name to something other than the file name if you want. Then click the “Create Project” button in the upper right-hand corner to finish creating your new project.
The interface is divided into two sections. The one on the left tells you what facets and filters (more in a moment) you currently have active. You can also click to the tab that says “Undo/Redo” to see a list of all the actions you have taken on your dataset and to “step back” if you want to undo something. While you can “step forward” and redo something you’ve undone, you can only do this if you haven’t done some other thing in the meantime.
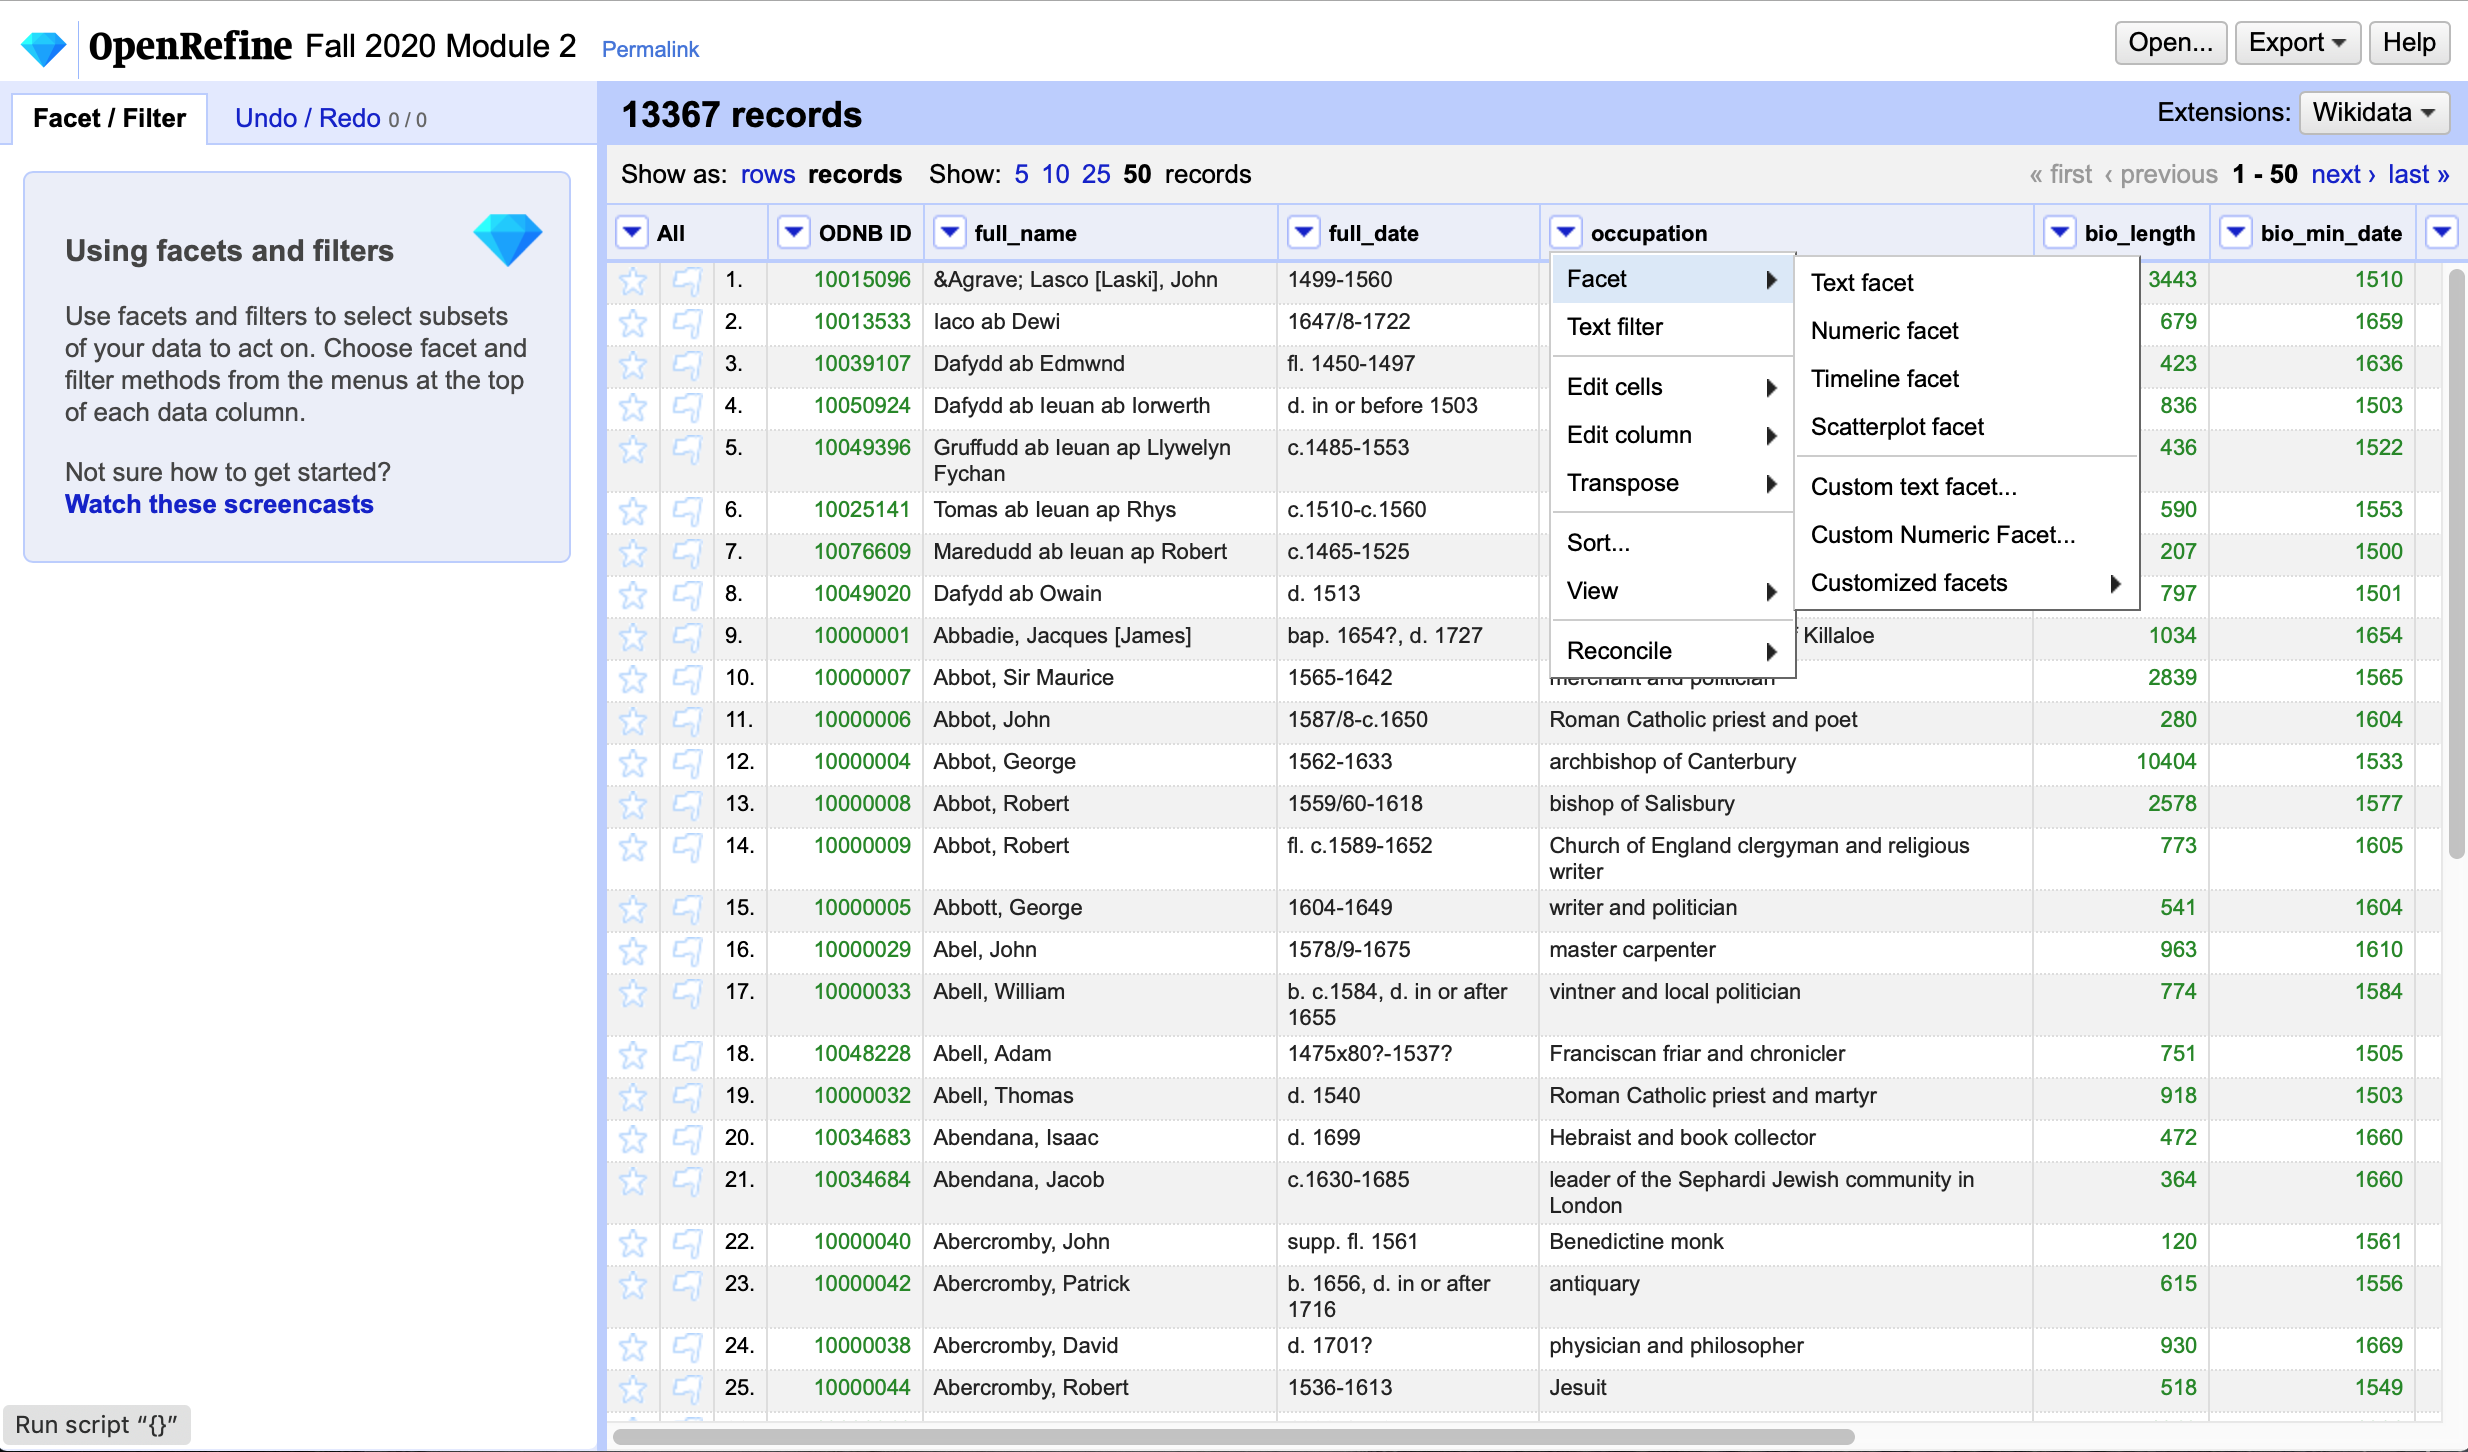
The center/right section shows you your data in a column/row layout and allows you to look at the next X records if you have more than the number of records displayed. The first thing I like to do on creating a new project is tell it to show the maximum number of records (50) which you can select from immediately above the column headers.
To perform most actions on the data, you will need to click on one of the triangles next to the column headers. In the screenshot above, I’ve clicked the triangle in the occupation column and am displaying the various faceting options. In addition, from this view you can “star” or “flag” rows, which is helpful when you’re attempting to create an arbitrary/manual subset of rows to perform bulk actions on.
Filtering and Faceting
When working with complex data, two of the most common things you’re going to want to do are to limit yourself to a subset of the data – whether for simply viewing that subset or to perform an operation on it. Open Refine lets you do that by filtering and faceting.
Filtering means simply searching for something and only viewing the rows with cells that meet those conditions. E.g. in the image below, I have searched for only people whose occupations include the text “poet and” (The fancy computing name for a bunch of random alphanumeric text is string.) There are 186 matching records and now that I have filtered down to them, I could perform some action on (like delete!) all people in the dataset who are poets and something else. Try filtering the occupation column on something that interests you and see what you turn up.

While filtering allows you to type in any text you want (aka a string), faceting allows you to choose from a number of pre-set options generated from the data itself. Below, I have selected two different faceting options on bio_min_date. The top option is the “text facet” which treats the numbers as generic text (a string). I can see how many cells have that text and can choose to include/exclude cells that contain that value, e.g. I could include the 5 1500 cells and the 2 1501 cells and exclude all the others from view. The bottom option is the “number facet” which recognizes the numbers as numbers and lets you use sliding sidebars to include/exclude certain date ranges.
Again, experiment with these, especially on the numeric columns (e.g. bio_length or bio_min_date) to see what you can figure out about the composition of the dataset. Unliking filtering, faceting does have some size limits – see what happens if you try to facet on something like “full_name”.

Transformations
While filtering and faceting are useful, the true power of Open Refine comes from the ability to filter/facet down to a subset of the data then transform that subset. As you can see in the sample data, the “full_date” column has some seriously messy data. Some people have birth and death dates as “1659-1726” while others have baptism and death dates as “bap. 1652, d. 1732” and others don’t have firm dates or don’t have birth or death dates. But if you can filter to, say, just those with baptism dates or just those with – dates, you can perform operations on them to transform them into separate columns of birth and death dates which can then be used to answer questions like “how many people in the dataset were born during the reign of Queen Elizabeth?” This cleaned data thus becomes useful for large-scale analysis in a way that the messy data is not.
You can access the transformations using the same column menus as faceting and filtering; there are submenus under each of the “edit cells” and “edit columns” items.
Under “Edit cell < Transform…”, you have the option to perform a custom transformation on any cell (say, transforming the occupation of all those “poet and …” people to just “poet”). Under “Edit cell < Common transforms” you’ll find a variety of prefigured options such as getting rid of leading/trailing whitespace (the dreaded “cat” is not equal to “cat ” in a spreadsheet problem) as well as use “To number” to tell Open Refine that “1501” really is a number or a date, not a string/random text, etc.
Under “Edit column < Split into several columns…” you can split columns based on arbitrary separators (e.g. splitting that date column on the “-” separator) but be sure to uncheck the box that will delete the original column unless you’re really sure you’re ready for it! You can also tell it to split into at most x columns, in case you’re worried you’ll end up with 30 or 50 columns when you only wanted 2 or 5 or 10.
With the “Edit column” submenu, you can also add a column based on existing columns or transform everything in a column, which can be extremely useful. These are slightly more difficult to use than the other transformations, but well worth the effort of learning them. Each has a large box (labeled “Expression”) at the top for you to put your transformation expression and a preview panel that shows the former (left side) and transformed (right side) value of your column for a few sample rows.
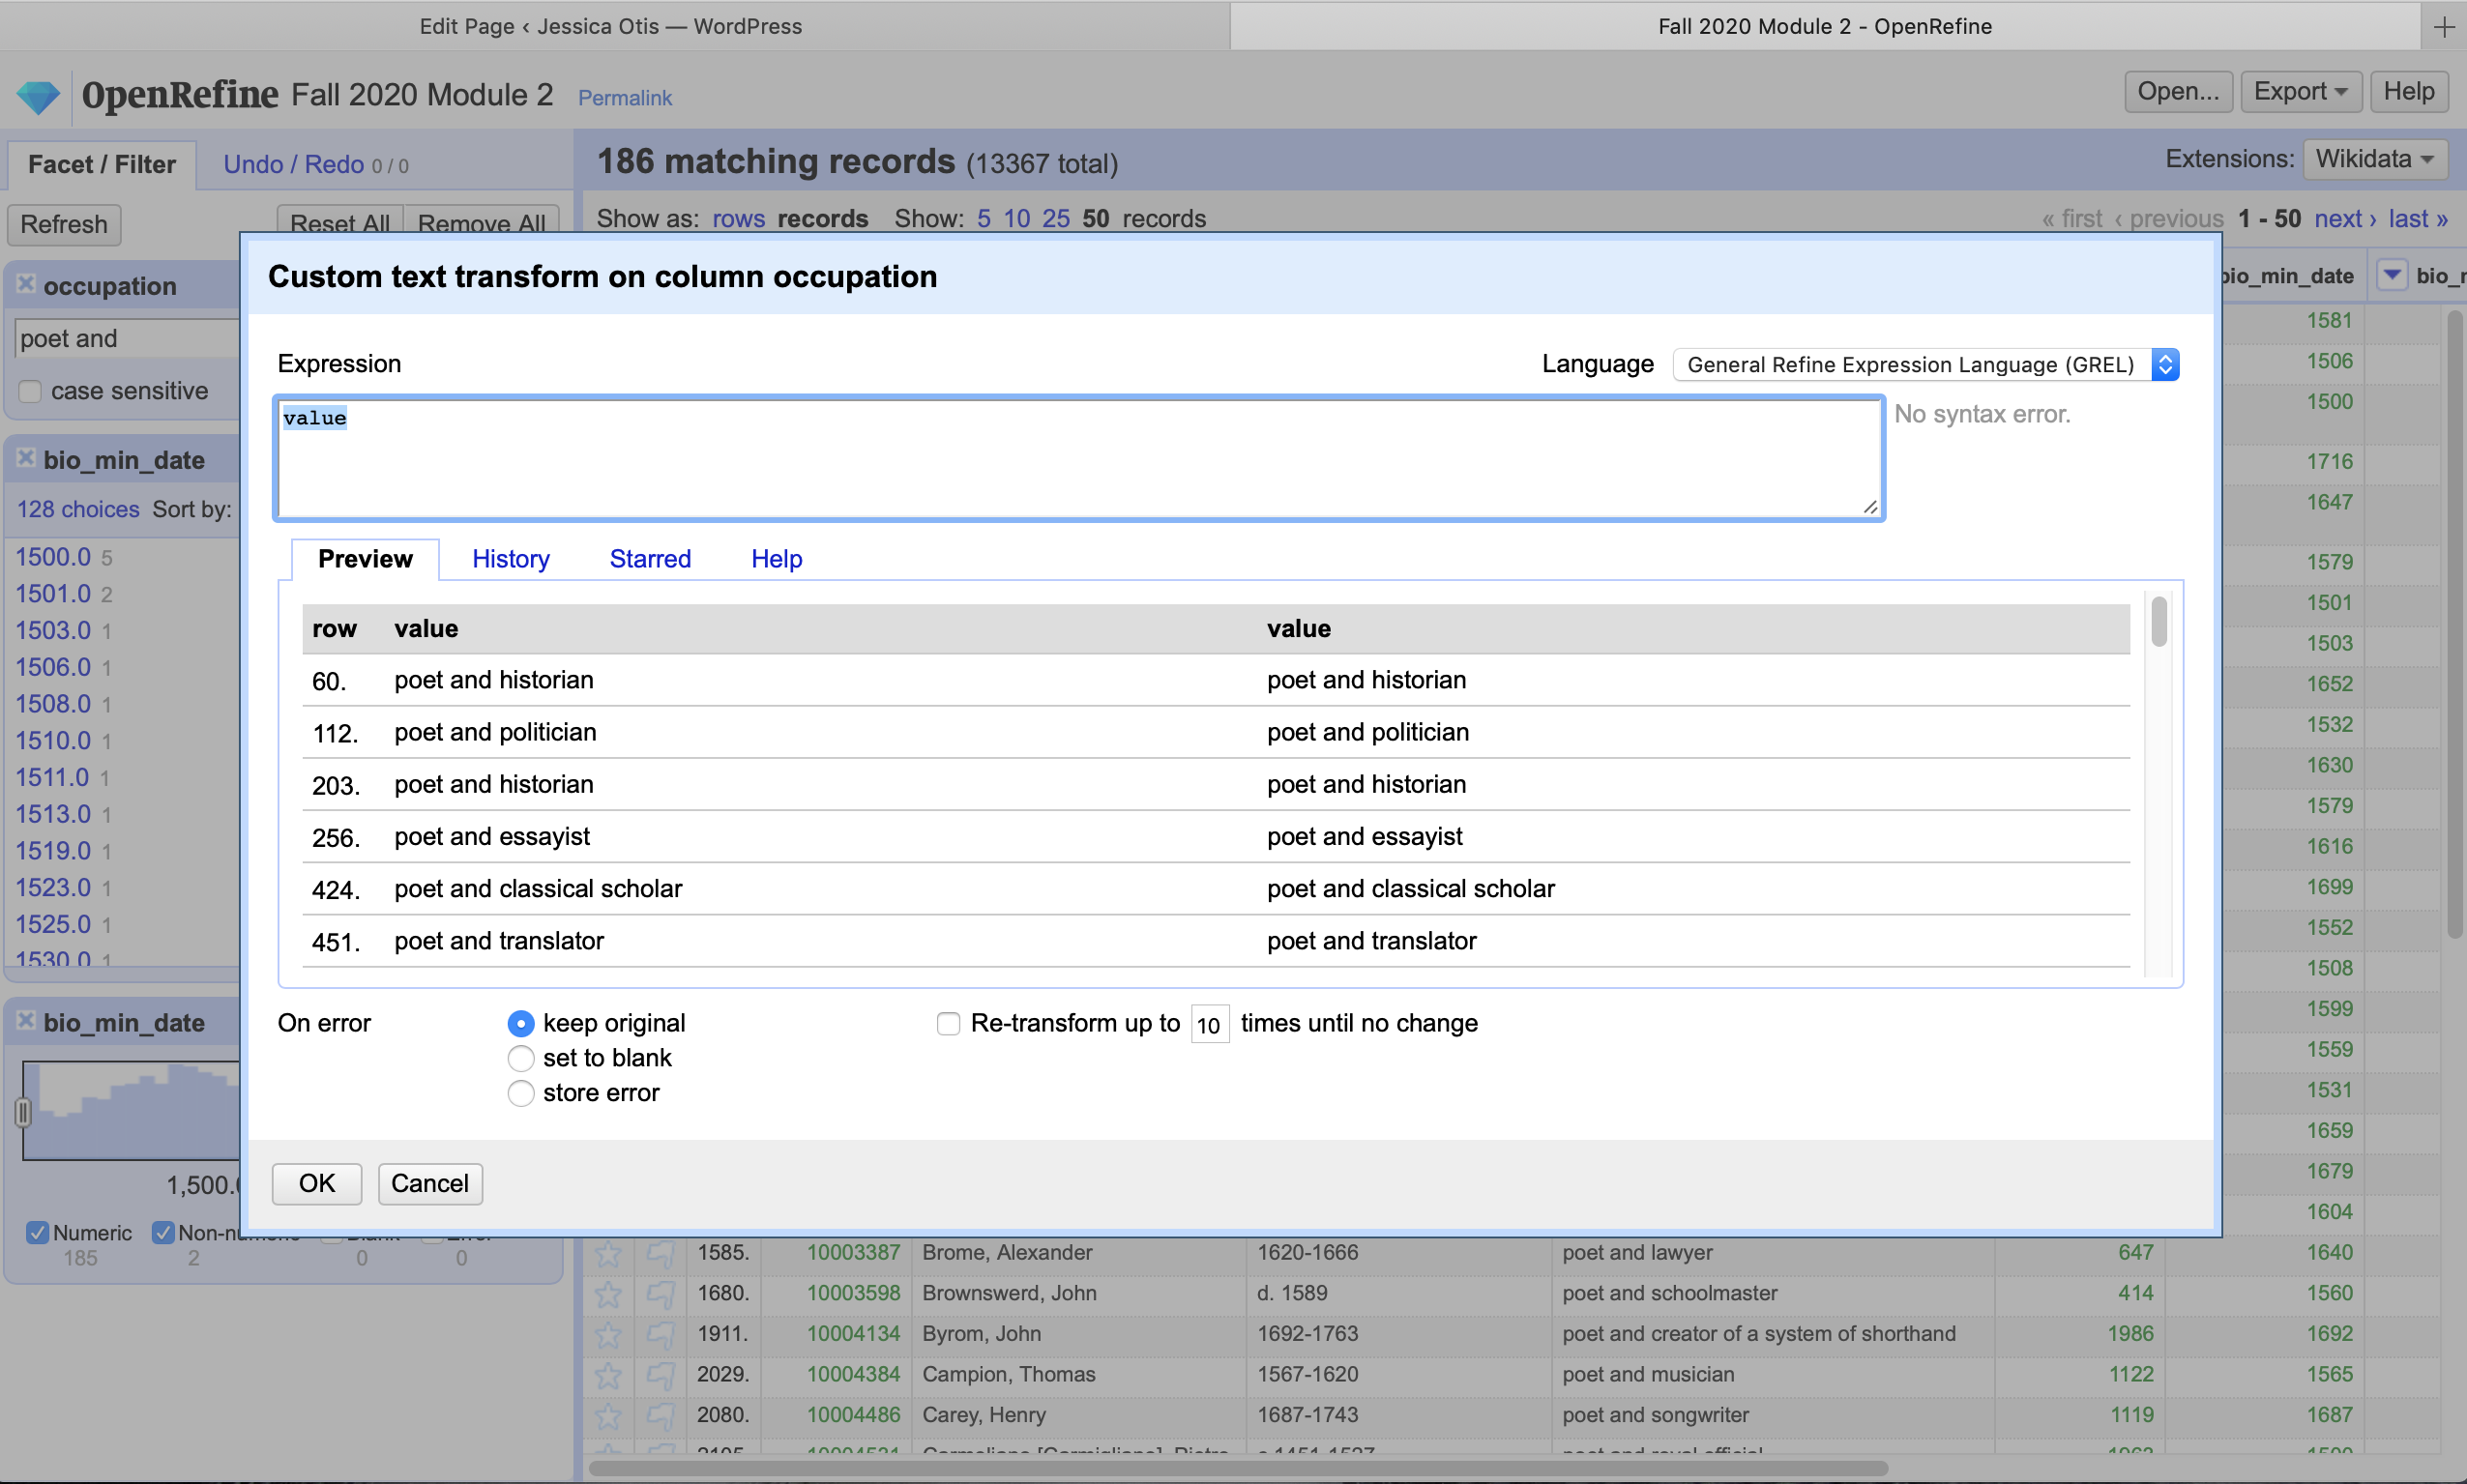
In the Expression box, “value” just means literally the current value of the cell. Try replacing value with “awesome person” to see what happens. Try again, but this time put quote marks around the words. The quote marks are telling it that you aren’t giving it a specific command, you want it literally to use the string “awesome person”. Put another way: if for some reason you wanted to replace the value of every cell with the word “value”, then you would add quote marks and it would understand you didn’t mean the current value but the actual word itself.
For number cells, you can use the traditional arithmetic operators to transform numbers. Since this is a text cell, see what happens in the preview column if you change it to “value + value”. Open Refine treats text/strings differently from numbers. Also, notice you’re missing a whitespace? How might you tell Open Refine to write the value, plus the space character, plus the value again?
Last, but not least, you can transform a column by adding information from other columns. Say, for example, you wanted to transform the full_name column into something that had both the person’s name and occupation? You would perform a transformation on the full_name column and replace the value with
value + cells[“occupation”].value
This takes the value of the column you’re transforming (full_name) then looks for the cell in the same row, in the column whose header is the string “occupation”, and grabs the value from that cell to add to it. Of course, this would result in a bit of a mess, so personally I’d go with
value + ” (” + cells[“occupation”].value + “)”
Then I’d have a bit of whitespace between the name and occupation and the occupation itself would be surrounded by parentheses to differentiate it from the name.
Exercise
Okay, that’s a lot to throw at you, but these things can be combined in VERY powerful ways to deal with messy data. So to try it out, take the sample data you’ve been looking at and see if you can transform them enough for you to be able to answer ONE of the following question sets.
- How many different given names are in the dataset? What is the most popular given name in the dataset and how many times is it there?
- How many people in the dataset were born the same year as Queen Elizabeth (1533)? How many people were born between her birth and the initial outbreak of the Great Plague of London (1665)?
This might be best undertaken with a couple of classmates for support. Make sure you first brainstorm what steps you’ll need to transform the data from its current (messy) state into a state that will let you answer the question. Try to map those steps to filtering, faceting, and transformations that will help you achieve your goal. Remember, it’s okay to remove data you don’t need! It’s not going anywhere, you can always “undo” back to the initial import.